It’s inevitable… a customer is selling your product on Amazon (or elsewhere) at a discount price. How dare they?! Don’t they know that drives the value down for your product? What do you do about it? In these scenarios, it’s good to have a MAP policy in place.
Continue reading “Making a MAP Policy”Category: How-To
How to Use Quickbooks to Keep Track of Pre-Orders and Backorders
If you’re looking for a way to manage your pre-orders and backorders, I just figured out how to do it with Quickbooks Premier. It’s super easy!
Continue reading “How to Use Quickbooks to Keep Track of Pre-Orders and Backorders”
How to Find Independent Sales Reps
If you have a product that you want to sell to retailers, you’re soon going to need help with sales. Following up with current and potential accounts takes a surprising amount of effort, especially as your list grows to 100+ leads, which it probably will after a single trade show. That’s a lot for one person to handle, especially if that one person is doing everything else in the business. The logical next step is to find sales reps.
In my industry, brands rely almost exclusively on commission-only independent sales reps rather than in-house reps that earn a mix of salary and commission. The reps operate as business owners themselves, picking up lines of products that go together, showing them to stores that they have relationships with, and writing orders on your behalf. They will be the primary point of contact with your customer (which, by the way, they consider as their customer).
Being a sales rep is hard work. You are knocking on a lot of doors and showing the line to a lot of people before you get any bites. Bites large enough to pay the bills with a commission check, anyway. For that reason, I recommend going with an experienced rep who has a lot of relationships in place instead of someone who is just getting started or just really likes your product and wants to help you out.
At Po Campo, we have gone through a lot of reps and, in doing so, I have developed a couple ways to find reps. Below are my methods from most successful (as in, bringing in the most and best quality orders) to the least successful.
- Ask the buyer which reps he or she likes working with. A good rep solves problems, is organized and brings new opportunities to them, which makes the buyer more willing to purchase product from her. This is easier to do for smaller shops than bigger chains, but I say something like, “I am looking for a rep that sells to stores like yours, do you have any recommendations?”.
- Ask other brands which reps they use and have had success with. Don’t ask direct competitors, but simpatico brands. For example, I look at what other accessory brands (hats, socks, etc) that my retailers stock and reach out to them for their recommendations. Most people are happy to share their good reps and can tell you which ones to stay away from too.
- Ask reps for their suggestions. If you find a good rep, you can ask her for her suggestions. She might know of someone who is looking to pick up a line like yours, or someone that she knows did a good job with a line in a different territory. I put this as my third suggestion because although reps offer suggestions very readily, I feel like they judge effectiveness differently than buyers or brands do.
- Industry rep organizations. For example, I was looking for a rep in the upper midwest and posted an ad on the MWSRA site and found someone.
- Trade shows are a common place for reps to pick up and trade lines with other reps. There’s often a message board where you can post something. Many reps have booths with their lines, so you can find one with an assortment that would work for you.
I find reps to be better at “farming” than “hunting” meaning that they will be better at selling your line to accounts that they already have relationships with. For that reason, if you know which stores you want to sell to, make sure any prospective reps know the buyers there and have sold them within the last year or so. If you’re not sure which stores you want to be in in a certain territory, ask the rep which of her accounts will be most likely to buy your product, and that should give you a sense of where your product will end up in the best case scenario.
How do you find sales reps? Please add your suggestions in the comments below.
Export Documents and Commercial Invoice Template
Some of Po Campo’s first customers were located in Germany and Japan, so I had to figure out the whole exporting thing early on. Each country seems to require different documents for importing (Thailand is the worst!), but there are two export documents that you’ll need to prepare regardless of which country you are shipping to: the Packing List and the Commercial Invoice.
You probably already have a packing list and invoice template that you use for your domestic shipping but the export versions look a little different and require some additional information. The first time we exported something, I downloaded templates of export documents off of the internet and just kept tweaking them until I found a solution that seemed to make everybody happy. This version is what I am sharing with you now. That said, I hereby absolve myself of any issues you may have with using my commercial invoice template or packing list template.
Both of these templates are in Excel, which makes for easy editing. Download the Packing-List-Template and Commercial Invoice template to get started.
Packing List
Most of the things on this template are pretty straightforward, like invoice # and PO #. Below are a few lines that might need a little explanation. Download the Packing List template.

- This should be where the products are shipping from. If your warehouse is separate from your office, use the warehouse address.
- B/L Number, or Bill of Lading Number. This will be given to you by the shipping company or freight forwarder.
- Item number or SKU number
- Material content. This is important for duty calculation.
- G.W. and N.W. refer to gross weight (includes the carton) and net weight (product only), respectively. The weight should be in kilograms. The Excel file will calculate the totals based on the number of cartons that you are shipping.
- CBM is CuBic Meter and refers to how much volume your shipment takes. It is calculated based on your carton dimensions in centimeters. The Excel file will calculate this automatically for you, or you can use this online cbm calculator.
The total number of cartons, weights and volume are automatically calculated and noted at the bottom of the spreadsheet.
Commercial Invoice
Again, most things on this template are pretty straightforward. Download the Commercial Invoice template.

- Shipper/Exporter is you, and this should be your business address (which may be different than the warehouse address)
- Consignee is the company receiving the shipment, most likely your customer
- Shipper is the company actually transporting the goods. My customer typically selects the shipper, and then I put that company’s info here (i.e. Kuehne + Nagel).
- Commercial Invoice # and PO # MUST match the numbers on the Packing Slip or pandemonium ensues.
- B/L (Bill of Lading) or AWB (Airway Bill) number will be given to you by the freight forwarder.
- Country of Origin is where the product was made and can affect duty rates with NAFTA. If you imported materials but made the product in the USA, I think it is alright to put USA in this field. But I’m not an expert! So have your reasoning ready in case someone should ask you about it.
- Terms of Payment is whatever you decided with your customer. This could say “Prepaid” or “Net 30” or “Due on receipt”, for example.
- Embarkation Port is the port where the product leaves our country. If you don’t know this, you can leave it blank.
- Exporting Carrier/Route is the path the shipment will take to go from you to the customer. Sometimes this appears on the B/L. If you don’t know it, you can leave it blank.
- Export Reference. I honestly don’t know what this is but it’s on every commercial invoice form so I just left it in there. I always leave it blank and haven’t been questioned about it. Fake it ’til you make it!
- Forwarding Agent is if there is another person or company involved in the shipment that is helping to arrange everything, like a freight forwarder. In my experience, usually the customer (consignee) handles everything and we don’t use a third party, in which case you can just leave this blank.
- Make sure these prices match what your customer is expecting. It seems that sometimes the customer prepares their own sets of documents and it can cause a lot of confusion if the prices don’t match.
Shipment Labeling and Handling of Export Documents
After you have export documents prepared, email a PDF of each to both your customer and shipping company to make sure they are satisfied with what you will be providing.
If you are shipping your product on skids, load all your boxes onto the pallets and wrap with shrink wrap. Attach the packing slip to the pallet using a packing slip envelope or just tuck it behind the plastic wrap. Print labels for each skid with the following information:
- Exporter (you)
- Consignee (your customer)
- PO #
- Pallet # (1 of 3, 2 of 3, etc)
If you are shipping your cartons loose, print carton labels for each box with the above information, but label the cartons 1 of 15, 2 of 15, etc, rather than the pallets. The packing slip should be adhered to the outside of the #1 carton.
Print two copies of the Bill of Lading given to you by the shipping company. Have the driver of the shipping company sign and date one of the copies for your records and send the other along with him.
Other Useful Tidbits
- You may think that it is better to ship on a pallet, but that is not always the case. Many countries insist on fumigating all wooden pallets to kill off any invasive species, which is insanely expensive, so often times it is best to ship loose boxes. If you decide to go the pallet route, I recommend plastic pallets, which cost about $35 each.
- Depending on the country and company, sometimes the shipping company or freight forwarder will send you more documents to fill out. If you don’t understand what to do with them, call and ask for assistance. You probably won’t be the first person to ask and it’s best to get it right.
- You might need to know the harmonization code for your product. This refers to the tariff code that classifies products. The U.S. International Trade Commission has a decent HTS Online Reference tool that you can use to look up your code. I use the code 4202.22.3500 for handbags with outer surface of textile materials.
Did I leave anything out? Do you do anything differently? Please share in the comments below.
How-To Measure Social Media (for Free)
Yep, social media can be an awesome, inexpensive and fun way to connect with current and potential customers and their communities. It can also be an excellent way to waste a lot of time and money. Are you wondering if your social media efforts are paying off? Here’s my method for how to measure social media for free (and not just for a first 30 day trial period either).
In the old days, people were obsessed with growing their fans and followers above all else. Times have changed, as we’ve learned that those metrics are not a good indicator of how well you’re connecting with your audience. Rather than counting how many fans you have or how often you are posting, pay attention to your engagement rate. Engagement is how often people interact with your content, either by liking it or sharing it or commenting on it.
The engagement rate is a blend of likes/comments/shares, but at Po Campo we break it down to look at each action separately. This takes more effort, but it sheds light on how the different platforms behave and helps you understand what to do to up your game in each space.
The Engagement Rate can be broken down into:
- Conversation Rate (Comments per post)
- Amplification Rate (Shares per post)
- Applause rate (Likes per post)
I used Facebook terminology, but all social media platforms have their equivalents. For example, on Twitter, Conversation = replies, Amplification = re-tweets, and Applause = favorites.
This concept was first introduced by Avinash Kaushik in his post “Best Social Media Metrics: Conversation, Amplification, Applause, Economic Value“, where he advocated measuring the outcomes and not activity. At the time, there was no easy way to get these numbers. Now, thankfully, there is. TrueSocialMetrics offer a service that measures these things automatically for you.

However, TrueSocialMetrics is not free; their most basic package is $30/month. While not terribly expensive, those monthly costs really add up, so I wanted to compare how much it would cost to do the same measurements internally. After devising this method on how-to measure social media, I found out that we could do it once a month for half the cost. Once a month is a frequency that works for us because, well, we’ve got other things to do besides just measuring social media.
In devising our own system, I added a few more metrics:
- Click-Through Rate, since one of our social media goals is to increase web traffic
- Relative Engagement Rate, to compare how active each follower is on each platform
- Economic Value Rate, to see how much money each social media platform brings in

I created a template on Google Docs for you to use. It consists of two worksheets:
The first tab is a worksheet where you enter your data in the top portion and the rates are automatically calculated below. We do this on the first day of the month. In my example above, you can immediately see which platforms are performing better across the different metrics: Facebook is great for conversations and sharing, Pinterest users are more engaged, Instagram gives us the loudest “applause”, meaning our content there is resonating well. Our Twitter account obviously is lacking across all metrics. I’ll dig deeper into what to do with these learnings in a separate post, but I bet you already have some ideas.
The second is a worksheet that calculates your month over month improvement. I meet with my social media team member in the beginning of each month to review our numbers and to identify what is working well and what needs some help.
Your next question is probably where to find the numbers to populate the top part of the “How-To Measure Social Media” table. Well, here you go! Below is how to find your data, platform-by-platform, using completely free services. Once you do it once, it’ll become quicker, I swear.
Jump to a specific social media platform: Facebook, Twitter, Pinterest, or Instagram.
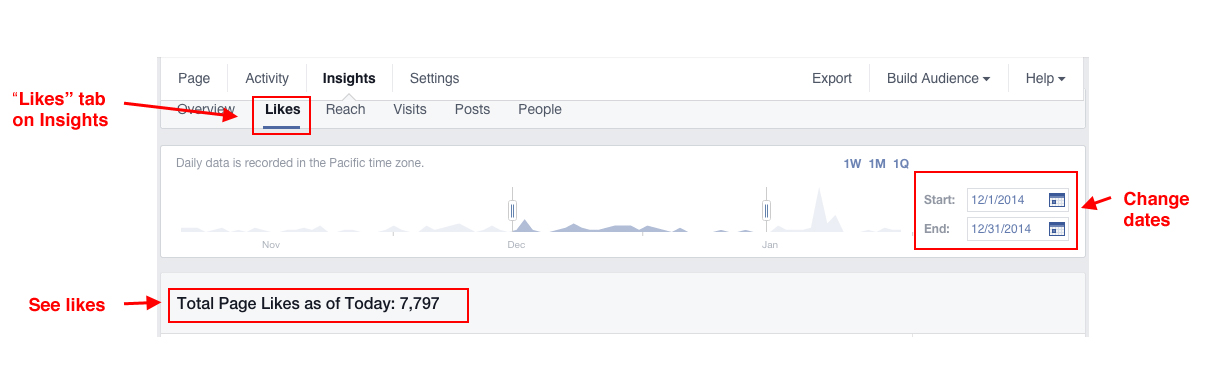
- # of Likes
- Go to your Facebook page’s Insights panel and click on Likes tab.
- Update dates at right side
- See total likes beneath graph
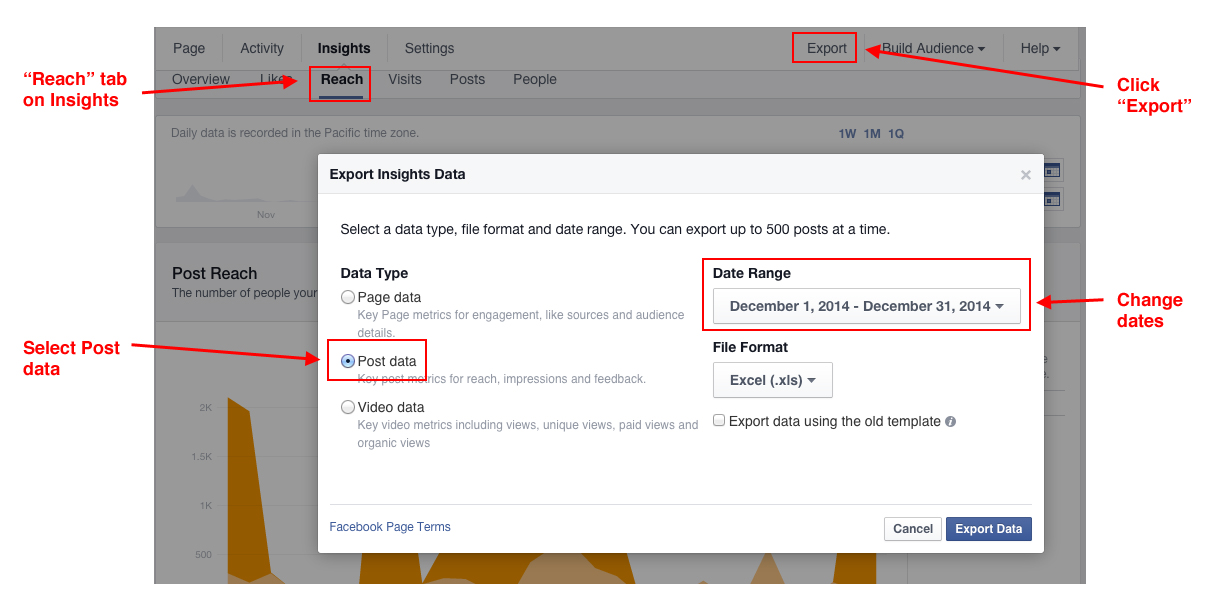
- # of Posts / Comments / Shares / Likes
This one unfortunately isn’t as straightforward because Facebook Insights shows you the average amount of comments/shares/likes that your posts received, not the totals, which are needed to calculate the rate. I prefer the rate over the average so you know how effective your posts are. If you can accomplish the same results with 20 posts instead of 200, that is a better use of time, and only the rate gives you that information.
- Go to your Facebook page’s Insights panel and click on Reach tab and click Export.
- Change dates in pop-up window and select the “Post Data” report
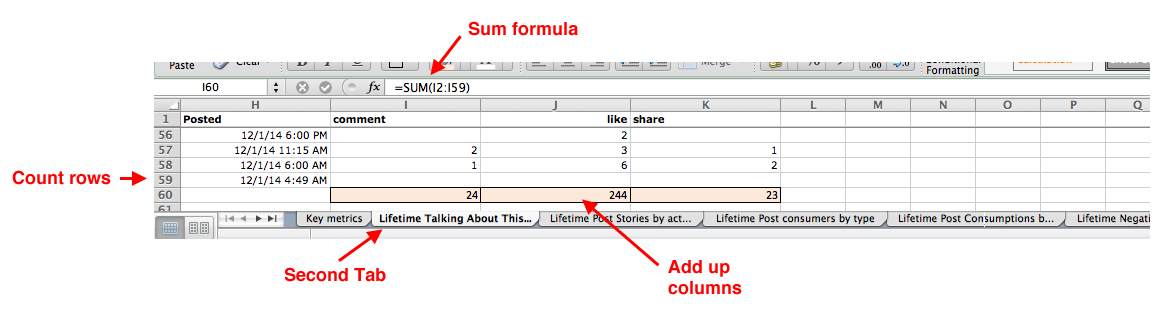
- Open the report in Excel and try not to feel overwhelmed. Navigate to the second tab titled “Lifetime: The number of unique people who created a story about your Page post by interacting with it. (Unique Users)”.
- See how many rows there are and subtract by two so as to not count the headers. This is your # of Posts value.
- Add up the values in Columns I, J and K (comment, like and share, respectively) to get those values.
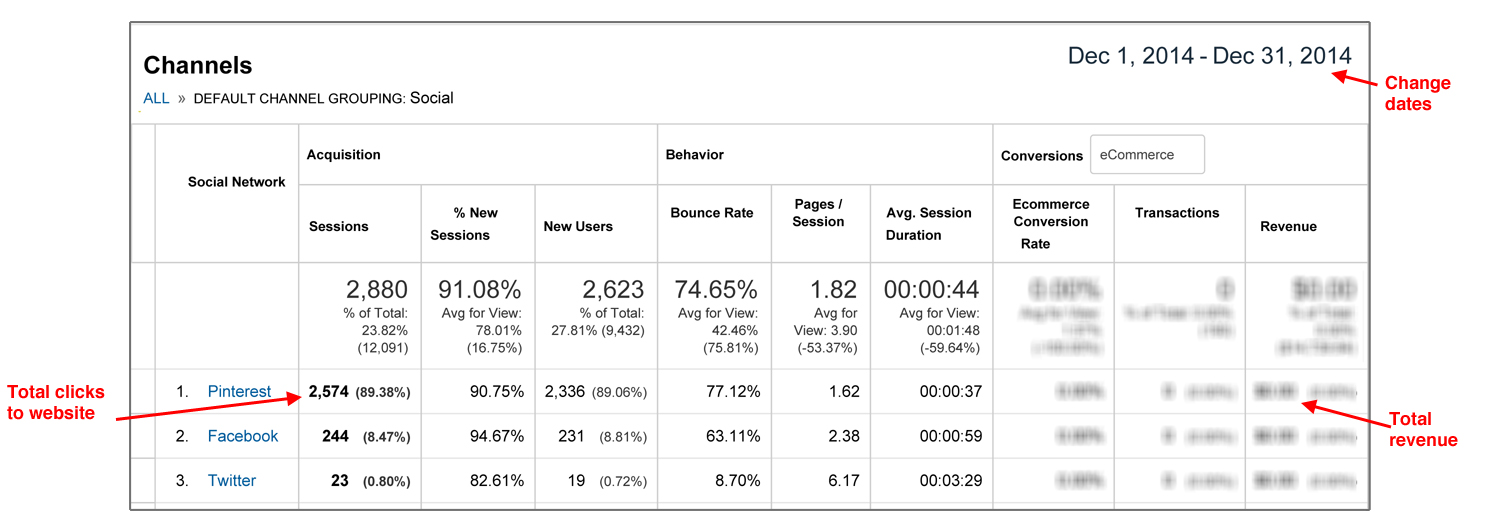
- # of Clicks to Website & Total Revenue
These last two values can be found in Google Analytics. You need to check both the “Social” channel and “(Other)” channel, as traffic from smartphone apps sometimes shows up in the latter.
- In Analytics, go to Acquisition > All Traffic > Channels and change the date at top.
- Click on Social to see traffic coming directly from the social media sites. Write down the total number of sessions (clicks to website) and total revenue.
- Go back to the Channels report and click on (Other) to see more traffic from those platforms that came to your site from a different app. Again, write down the sessions and total revenue from each channel.
- Add the values from #2 and #3 together and put them in the worksheet.
Twitter
You’ll need to set-up a free Twitter analytics account to access these reports.
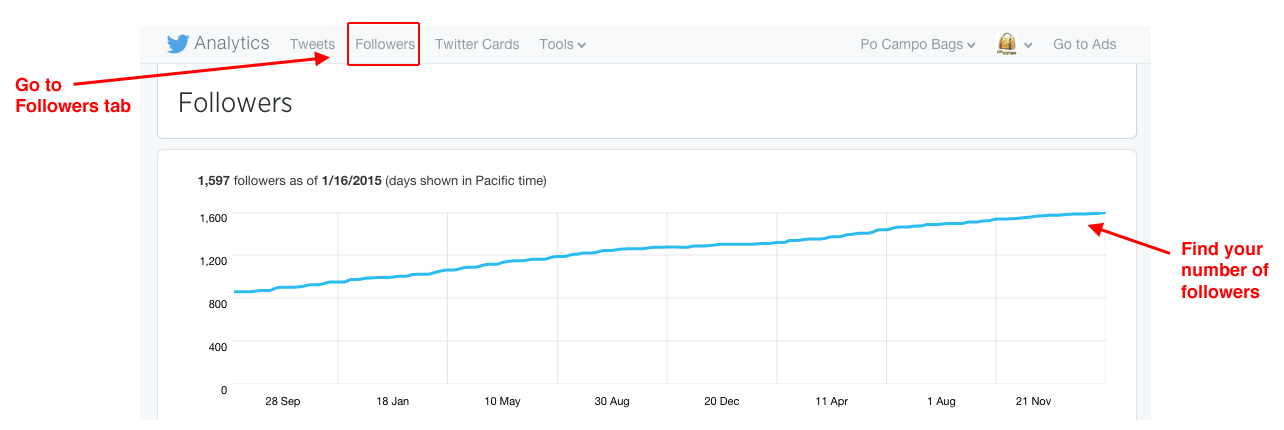
- # of Followers
- In your Twitter Analytics page, go to “Followers” tab
- Find your number of followers on a particular date on the bar graph.
- # of Posts / Replies / Retweets / Favorites
Similar to Facebook, Twitter Analytics makes it easy to see the averages but difficult to see the totals. You have to download the data and add it up in Excel.
- In Twitter Analytics, go to “Tweets” tab and click “Export Data”. This can take awhile because it exports ALL your data.
- Once opened in Excel, copy the rows of tweets that were posted in your time period and paste into a new worksheet. (This is optional, just makes it easier to work with).
- Count the number of rows to get your # of Posts value.
- Similar to the facebook data above, add the values in column H, I, J to get your total Retweets, Replies, and Favorites, respectively.
- # of Clicks to Website & Total Revenue
These last two values can be found in Google Analytics, same as above.
Pinterest
You will have to set up a free business account on Pinterest to get access to their analytics.
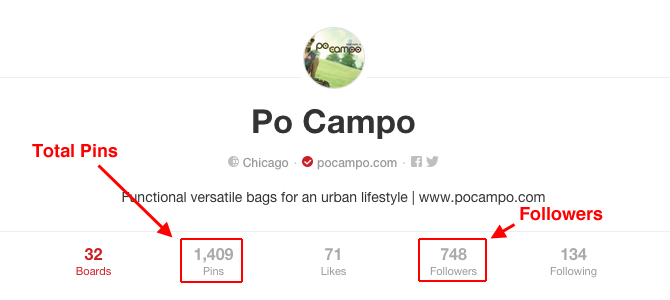
- # of Followers and # of Pins
- Your # of followers can be found on your main profile page. There is no way to find it back-in-time, so just be diligent about recording this number on the last day of the month.
- There’s no way to see how many new pins you posted during the time period, but pins tend to live on longer on Pinterest anyway. Therefore, we record the total # of our pins on all of our boards for this metric.
- # of Repins / Likes
Once again, you have to download the raw data to be able to count these metrics, as Pinterest analytics only gives you the averages for a certain time period. The raw data only shows you your top pins, not everything, but I’ve found this to be workable. Sadly, Pinterest Analytics does not offer a “comment” metric, so we are unable to determine the conversation rate for this platform.
- In Pinterest Analytics, go to Your Pinterest Profile tab and select the Impressions option. Change the date and then click “Export”.
- Similar to the facebook data above, in the”Top Pin impressions” section, add the values in column G & H to get your total number of repins and likes.
- # of Clicks to Website & Total Revenue
These last two values can be found in Google Analytics, same as above.
Instagram
Instagram does not offer its own analytics yet. We use a free account on Iconosquare for these basic metrics. Most of their statistics are on a rolling monthly basis, so it’s best to be diligent about getting these numbers on the last day of your recording period. Since Instagram does not really have a “Share” option, we skip the Amplification rate for this medium.
- # of Followers
- Navigate to the “Statistics” tab in Iconosquare. Your number of followers is on the main Overview page.
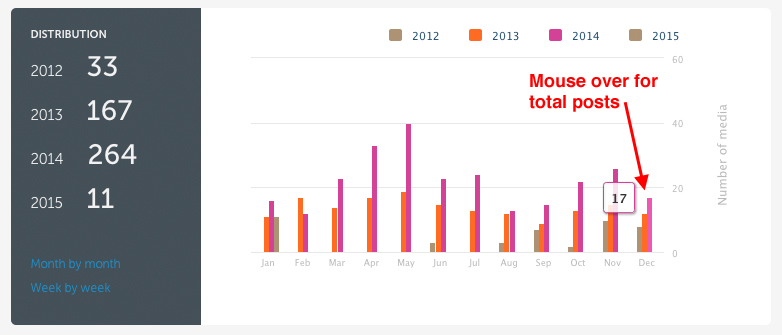
- # of Posts
- Click on “Content” on the left side. Your # of our posts during each month are visible in the Distribution graph.
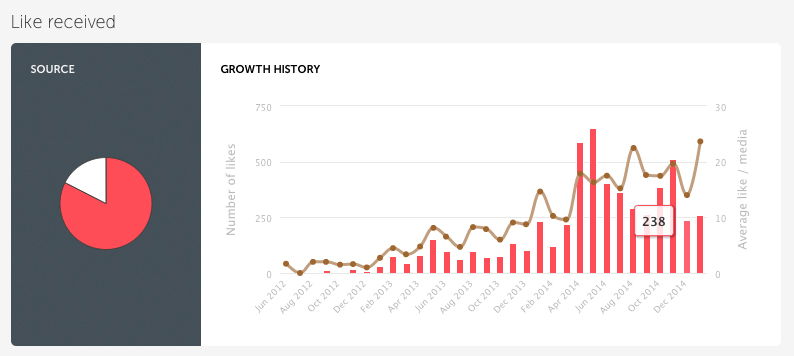
- # of Likes / Comments
- In Iconosquare, click on “Engagement” on left side. In the “Like Received” graph, mouse over the bar for the month to see the total number of likes.
- For Comments, do the same thing on “Comment Received” graph.
- # of Clicks to Website & Total Revenue
These last two values can be found in Google Analytics, same as above. Instagram traffic will most likely show up only on the “(Other)” channel, for whatever reason.
Now that you know where to find your measurements, and what to do with them (put them in my Measuring Social Media table!), I look forward to hearing about your insights. If you have better tools, please share, especially if they are free. It seems like most services are built for agencies managing multiple brands or big brands with big budgets, and not too much for us little guys. That’s why this DIY method seems like the best option for right now.
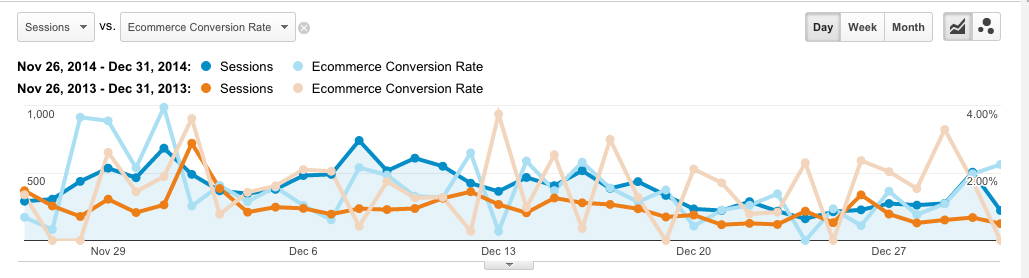
How I Increased our Holiday Sales by 87%
My post “How I Plan to Maximize Holiday Sales” from 11/18/14 outlined my strategy for cashing in on the holiday shopping season. Are you curious about how my plans worked out? Now that the dust has settled, I checked to see how well we did.
I pulled these reports with Quickbooks and Google Analytics. Details on how to do so are in each metric.
Overall Goal: Double sales over 2013
Result: Overall sales increased by 87.2%. So not quite double, but pretty close.
Analysis: Of course it always burns a bit to not quite hit your goal, but overall I am happy with how the season turned out.
How I know this: In Quickbooks, I ran a Profit & Loss Statement (P&L) for the holiday time period and compared 2014 against 2013.
Goal: Double retail event sales by doing many more events
Result: Event sales increase by 98.7%. Hurray! Again, not quite the goal, but pretty darn close.
Analysis: We did a whopping 8 events (as opposed to just one in 2013), and that strategy obviously worked. That said, we were all pretty exhausted by the end of the month. Next year we’ll skip some of the slower shows and enlist more volunteers so we aren’t working seven days a week.
How I know this: In the same P&L statement from above, I filtered it for our “Retail Events” customer. We didn’t set-up a Retail Events customer until midway through 2014, but since we use Square for credit card transactions at events, I was able to figure out the 2013 sales with a Square sales report.
Goal: Maintain the momentum of increased traffic to our website by 56% over 2013
Result: Traffic increased by 62.3%.
Analysis: I attribute the extra bump in traffic to just more people being online and shopping.
How I know this: In the Google Analytics Acquisition Overview report, I compared 2014 against 2013. I refer to “Sessions” to represent inbound traffic.
Goal: Increase referral traffic by roughly 50% by being in more gift guides
Result: Referral traffic increased by 41.2%.
Analysis: Despite not hitting our goal, I am very pleased with how this strategy played out. Our e-commerce conversion rate from referral increased to an impressive 9.73% (compared to 0.41% in 2013), and of course that is a better metric than just traffic. We will push harder for gift guides next year, and get started on them earlier.
How I know this: In the same Google Analytics Overview report, then just clicking on the “Referral” line to dive into that report.
Goal: Invest in social media advertising to increase conversions.
Result: Our traffic from social increased an impressive 435.7% and our e-commerce conversion rate increased 214%. The vast majority of both traffic and conversions came from Pinterest.
Analysis: Obviously the Pinterest increase is a huge win, and interesting because we didn’t put any marketing dollars there. We did advertise on both Facebook and Google, and hardly saw a bump from those advertising efforts. Next year we will double down on Pinterest and try advertising there instead.
How I know this: In the same Google Analytics Overview report, then just clicking on the “Social” line to dive into that report.
Goal: Keep drop ship account momentum going, which had increased 74.1% over 2013.
Result: During the holidays, our drop ship orders increased by 132.1%!
Analysis: We offered our drop ship accounts limited-time discounts on certain SKUs so that they would have styles to promote during the big shopping days like Black Friday and Cyber Monday. We also changed to shipping every day (rather than just Monday, Wednesday and Friday) so that they can offer more shipping days.
How I know this: In Quickbooks, I ran a report under “Manufacturing & Wholesale Reports” called “Sales by Customer Type” and filtered it for the “Drop Ship” type. Note: You have to be using the Quickbooks Premier: Manufacturing & Wholesale Edition to have access to this report. Another method would be to just compare sales from these accounts from one year to the other.
Overall I am very pleased with how the holiday sales turned out. It’s great to end the year on a high note and to sell through a lot of inventory. For 2016, I want to reduce the craziness by getting a headstart on some of these initiatives, especially pitching the gift guides and our social media campaigns earlier on.
If you had particular success with any of your holiday marketing strategies, please share in the comments below.
How-To Use Surveys to Inform a Marketing Plan
In mid-November, I was working on Po Campo‘s marketing plan for 2015 and realized it was largely based upon who we thought our customer was and what we thought she thought about us. We have a lot in the pipeline, both as far as new product development and marketing plans go, and I felt like it was time for gut-check with our customers to make sure we were on the same page.
Determining Objectives & Questions
I decided an online survey would be the easiest way to quickly check-in with our current and potential customers. From my past experience as a design researcher, I know that having concise objectives is key to a successful study. Using SurveyMonkey.com ($19/month for basic), I built a survey around answering the following questions:
- We think of our customers as mostly active, urban minded women between 25 and 45 who live in bike friendly communities. Is that true?
- We think “women-run”, “design-led” and “inventive combinations of style and function” are the brand attributes that resonate strongest with our customers. Is that true?
- We’re developing yoga, baby and lifestyle bags and exploring wearables. Do we have license from our customers to stretch our brand into these areas?
I ended up designing a twenty-two question survey, which included a few more questions than necessary to answer the above objectives but it’s hard to resist the temptation of asking people things that you’ve been wrestling with while you have their attention. For me that included getting clarification on whether they see Po Campo as more of a bike, fitness or lifestyle brand to help us sort out our chaotic retail strategy and which brand archetype best suits us to help us determine tone of voice.
Insights from the Survey
We had 624 total respondents, mostly recruited through our newsletter list (88%) and Facebook (12%). Most respondents were existing customers (66%), while 30% were potential customers, in that they didn’t own a Po Campo product but were familiar with what we do.
For the first two objectives above, our assumptions were pretty accurate. We did learn that women value that Po Campo is a women-run business much more than men do, while men value that we are design-led much more than women do. That learning kind of plays into the stereotypes of men and women but so be it.
The answer to the third objective gave me pause: the majority of both our current and existing customers will probably not be purchasers of most of our new products as they do not engage in the activities we are designing for. On one hand, this is okay, because we can expand our pool of potential customers; on the other hand, marketing to a whole new group of people will be a lot of work.
Learnings from our secondary objectives were even more insightful as they challenged my existing perceptions of our brand. When asked what type of store environment would be the best fit for Po Campo, the majority of people (69%) chose either a bike store or a Athleta-type fitness store. The lifestyle boutique and designerly gift shop were much less popular answers, with 14% and 11% respectively. I always kind of thought of us as more of a boutique brand but our audience clearly has us in a more athletic context.
To help us determine our brand archetype, I asked a fill-in-the-blank question that said “When I think of Po Campo, I picture a brand that is all about…”. The clear winner to this question was the response that said “…being down-to-earth, reliable and trustworthy”, the answer that represented the “everyperson” archetype. I always thought of Po Campo as the Explorer archetype so this was something new. In researching the Everyperson, it does make a lot of sense to me, and has helped me understand the role we play in our customers’ lives better.
Action Steps
Analyzing research without laying out steps of action is a missed opportunity. Based on our research, this is what I will do next:
- Research the new markets we plan to enter to confirm that our offering fills a need and is differentiated from existing products and brands. If it is, develop a marketing plan for each of the new product launches.
- Revisit our marketing plan and focus it in on “active healthy living”.
- Revisit marketing plan to focus on telling the “women-run” part of our story better, especially for content targeted to women.
Click here to see the complete survey. Please note that logic was included in the survey, so not all people saw all questions.
Have you conducted any surveys lately? What tips do you have to share?
How to Make a Good Soft Goods Tech Pack
Have an idea for a bag design and want to get quotes from a soft goods manufacturer? One of the first things they will ask you for is the “tech pack” for your design, so they can make a sample of the bag to see how complicated/time-consuming it will be to produce. The tech pack generally consists of three things:
1) Sketches of the design concept with material call-outs. For simple designs, this can be a simple three-quarters view sketch that shows the front, side and top. Additional sketches may be needed to show how a pocket opens or other such details. Be sure to include stitch lines.

2) Orthographic / elevation drawings with dimensions. I take pride in providing our suppliers with very detailed drawings that leave little room for guesswork. This forces me to think through all the bag’s details in advance of sharing the concept with the supplier, which in turn helps the factory produce samples quicker and easier.

3) Bill of Materials (BOM). Again, the more detail you can provide here, the better off you will be. The factory may use other materials for the initial sample but it will always be clear what you are intending for the final product.

How long should the tech pack be?
Most of my tech packs are three pages long, one page for each item above. More complicated designs may require additional pages to explain some of the details and features. There is no limit to how many pages you can include, but in my experience, the more concise you can make things, the better.
What software do you use?
We do all of our technical drawings in Illustrator. I’m quite reliant on using its “Smart Guides” feature to quickly align objects, to find intersections and anchor points and to see measurements as I draw. I first draw everything full-size on a large artboard and then scale it down proportionately to fit on a letter-sized piece of paper. There is also an Illustrator CADtools plug-in that helps with dimensioning and material call-outs.
Besides the orthographic drawings, we make our BOM in Excel and then share it all with our factory as a multi-page PDF.
How do you show updates and revisions?
After you receive your sample, you’ll probably want to make some revisions. I’ve found the best way to do this is to clearly mark everything that is changed on the next version of the tech pack so that the sample maker can quickly see what needs to be done differently.
Do you have to create a pattern?
No, thankfully in bag design, you do not have to create the pattern. The sample maker figures this out based on your tech pack.
What if I’m unsure about what materials to spec?
If you don’t specify the materials, the factory will tend to use either what they have lying around or what they can get at a good price. In other words, they’ll use what’s easiest for them and not necessarily what’s best for your design. Therefore, I always try to specify something. If you have a sample of a material but you don’t know what it is called, send the sample and ask them to find something similar and include the “Sample Fabric A” in the BOM until you have a better name for it.
Is collaboration lost if you are being so “prescriptive” and “detailed”?
While we designers revel in concept development and iterative prototyping, you have to remember that factories make money from production, not sample making, and therefore every effort to streamline the sampling process is greatly appreciated. Expect collaboration to take the form of factories offering suggestions on how to make your design more efficient to produce.
It took me awhile to learn this. My first job was making bags for Arctic Zone, whose biggest customer was Wal-Mart. We constantly made samples without nary a grumble from the factory because they knew a huge order was the pay-off. With small companies, like Po Campo, there is no assurance of a huge order, or any order for that matter, at the end of the sampling process, so factories are much less interested in endless sampling. I have found working relationships best if we can get to the final prototype within 2-3 rounds of sample making.
Do you prepare the tech pack the same for both domestic and overseas manufacturers?
Yes. With native English speakers, there is less risk of things getting lost in translation, but I have found the importance of a concise tech pack to be the same regardless of where the factory is based.
Any other questions? Please leave in the comments below. Do you do things differently? I’d love to hear from your experience, as I’m largely self-taught.
How to Use Google Trends to Select Keywords
I was recently updating the product descriptions, page titles and meta descriptions on Po Campo’s e-commerce site to be more search engine friendly.
The first thing I did was research keywords in Google’s keyword planner to find product types and descriptions with the coveted combination of high search frequency and low competition. Po Campo makes a niche product, which means I don’t expect people to search for products like ours a thousand of times per month. Rather, I look for words or phrases that are searched for about a hundred times per month and have a “medium” competitive rating.
Occasionally you find yourself with a few options of keywords that describe the same thing and are similarly appealing from a search frequency and competition perspective. One example of this for me was how to describe the synthetic leather on our bags. “Vegan Leather”, “Faux Leather”, and “Synthetic Leather” are all searched for a decent amount of times and have a low to medium competitive rating. So which should I use in our product descriptions? A mix or stick to one? To answer that question, I checked with Google Trends.
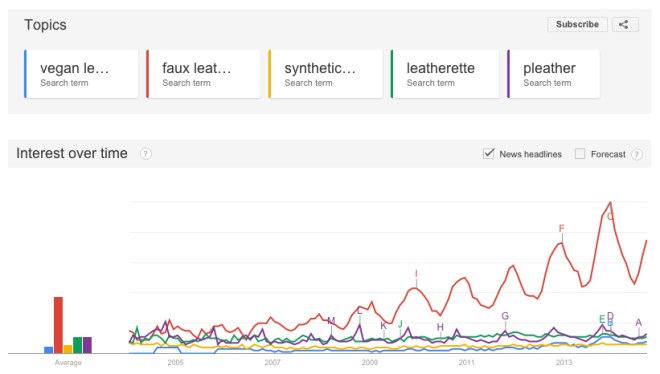
By comparing similar descriptions for fake leather, I learned that “faux leather” is clearly trending, so I updated all of our product descriptions to include that phrase.
With all else being equal, try using Google Trends to understand where the popularity of certain keywords is going so that you don’t choose keywords that are going out of favor. Plus, it’s fun!
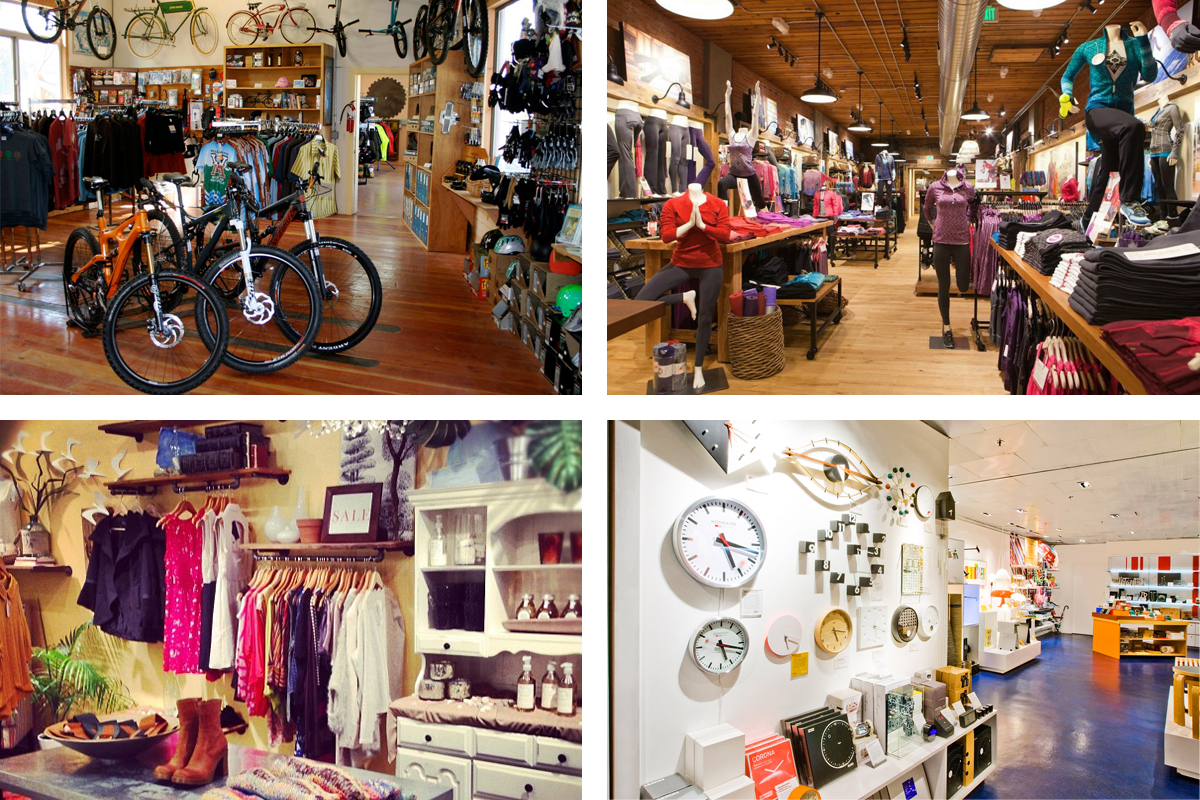
How To Get Your Product Into Stores
It’s common nowadays to launch your product on Kickstarter or a Shopify store, but neither of those options were really around when I launched Po Campo in 2009. Getting our bags in physical stores was our main sales strategy when we were starting out.
That first summer, Po Campo was available in about a dozen stores in Chicago, which was a good start and we really have just built on that. One of the most common questions I get is “how do I get my product in stores?”. Well, this is how I did it!
Step One: Make a List of Stores to Approach
I made a list of about 20 shops that I thought Po Campo would be a good fit in, based on where I and my friends liked to shop, since we were my intended consumer. I also thought about which brands were complementary to Po Campo, in terms of style and pricepoint, found out where they were locally being sold and added those stores to the list. Small, independent shops are much easier to cold-call and get into than larger chains, so start there.
Step Two: Research
Before you start walking into stores, do some research on how to build out your sales program with wholesale pricing, minimums and terms. To find this information out, I asked store owners and other product companies about what they do. I have found people to be very helpful and forthcoming with this information, so don’t feel weird about asking. Specifically:
- What is your wholesale price? This can vary by product category and industry. For bags like mine, the wholesale price is half of the retail price (this is called keystone).
- What is your minimum opening order? Is there a minimum reorder? This is usually based on a quantity (e.g. minimum of 10 pcs) or a dollar amount (e.g. minimum of $500). Based on my research, I chose to do a minimum starting order of 6 pieces, so enough to make a decent Po Campo display but not too much to make it seem like a big commitment for a small shop, who doesn’t want extra inventory lying around with no place to store it. We don’t have a reorder minimum because we want our retailers to feel free to place special orders for customers.
- What are your payment terms? The basic options here are:
- Due on receipt (pay right away). The faster you can get paid, the better. Our first orders were pretty small (less than $300), so most shops were okay with starting out this way. You can use Square or PayPal to take credit cards right away; the ease of credit cards more than makes up for the cut the credit card companies takes, in my opinion.
- Net 30 (pay in 30 days). This is pretty standard but I suggest doing a credit check before you give anyone product as it is practically impossible to get it back if they don’t pay. Old school credit checks require the store to first fill out a credit application, then you contact their references to see how good they are about paying on time. The process feels antiquated (although effective), so now Po Campo uses Cortera, which costs money but is quicker.
- Consignment (pay when the product sells). Small shops love this because it is essentially risk-free for them but that puts all the risk on you, plus it is a pain in the butt to manage. Therefore, I wouldn’t even offer this option and focus your attention on stores with enough cash to buy the product outright.
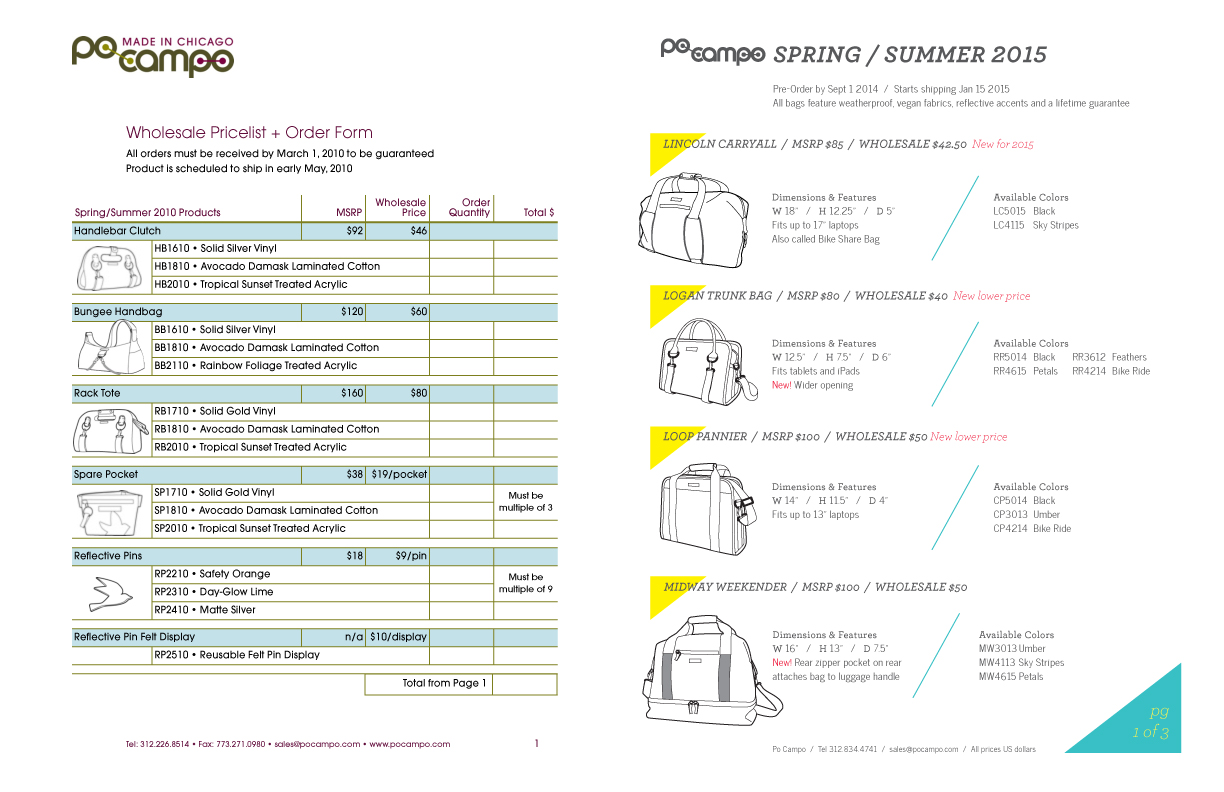
Step Three: Build Your Materials
Put together a (preferably one page) line sheet with:
- Product drawing or photo with item number, dimensions, brief description, color options (if any)
- Retail and wholesale price
- Minimum order amount
- Order deadline
I’ve found that it is immensely helpful to have a sample with you, even if it isn’t perfect. Samples about 90% of the way there are good enough.
A lookbook or catalog is nice but not necessary when you are just starting out. At this stage, you are the best representation of your brand. Introducing your product in person does more to sell your brand than a lookbook ever could.
Step Four: Start Selling
You’re ready to start going door-to-door! This is great practice for honing your pitch and learning how to clearly communicate the most interesting aspects of your product/brand. Practice makes perfect, so don’t be hard on yourself if your first visits are clunky. Here’s what I did:
- Find the owner/buyer and ask for a few minutes of her time, or schedule a time to come back. You’ll really only need 5-10 minutes.
- In a few (rehearsed) sentences, tell her about your brand and why you designed the product the way you did. Let her play around with the sample, answer her questions, go over the items on the line sheet.
- If she seems interested, ask for the sale by saying something like “Can I get an order going for you?”. It may seem a little confrontational, but trust me, it’s necessary. Few people will just say, “This is great, I’ll take 10!”.
- Leave your line sheet behind, maybe with your business card stapled to it, so she has a concrete memento of your visit. Get her email address and send her an email later that day to thank her for her time and to confirm her order or suggest an order based on what you talked about.
And if she says she’s not interested? You have to train yourself to hear “not yet” whenever you hear “no”. Jot down why she said no (might just be timing or wrong color) so you know when to go back to her in the future. Then move on to the next store on your list.
Okay, that’s it! In some ways it feels like a numbers game, in that you’ll get a new customer for every 4 qualified stores (or whatever) that you visit. Try to make your pitch a little better every time by listening to questions people have and noticing what they are responding to, both positively and negatively.
Good luck and share your experiences!