If you’re looking for a way to manage your pre-orders and backorders, I just figured out how to do it with Quickbooks Premier. It’s super easy!
Continue reading “How to Use Quickbooks to Keep Track of Pre-Orders and Backorders”
Maria Boustead | Soft Goods Industrial Design
If you’re looking for a way to manage your pre-orders and backorders, I just figured out how to do it with Quickbooks Premier. It’s super easy!
Continue reading “How to Use Quickbooks to Keep Track of Pre-Orders and Backorders”
My post “How I Plan to Maximize Holiday Sales” from 11/18/14 outlined my strategy for cashing in on the holiday shopping season. Are you curious about how my plans worked out? Now that the dust has settled, I checked to see how well we did.
I pulled these reports with Quickbooks and Google Analytics. Details on how to do so are in each metric.
Overall Goal: Double sales over 2013
Result: Overall sales increased by 87.2%. So not quite double, but pretty close.
Analysis: Of course it always burns a bit to not quite hit your goal, but overall I am happy with how the season turned out.
How I know this: In Quickbooks, I ran a Profit & Loss Statement (P&L) for the holiday time period and compared 2014 against 2013.
Goal: Double retail event sales by doing many more events
Result: Event sales increase by 98.7%. Hurray! Again, not quite the goal, but pretty darn close.
Analysis: We did a whopping 8 events (as opposed to just one in 2013), and that strategy obviously worked. That said, we were all pretty exhausted by the end of the month. Next year we’ll skip some of the slower shows and enlist more volunteers so we aren’t working seven days a week.
How I know this: In the same P&L statement from above, I filtered it for our “Retail Events” customer. We didn’t set-up a Retail Events customer until midway through 2014, but since we use Square for credit card transactions at events, I was able to figure out the 2013 sales with a Square sales report.
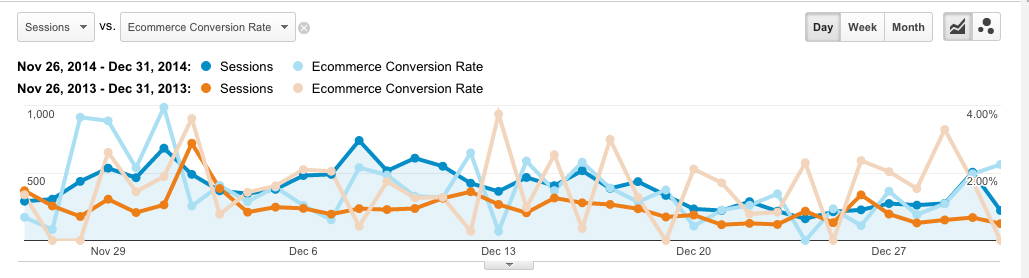
Goal: Maintain the momentum of increased traffic to our website by 56% over 2013
Result: Traffic increased by 62.3%.
Analysis: I attribute the extra bump in traffic to just more people being online and shopping.
How I know this: In the Google Analytics Acquisition Overview report, I compared 2014 against 2013. I refer to “Sessions” to represent inbound traffic.
Goal: Increase referral traffic by roughly 50% by being in more gift guides
Result: Referral traffic increased by 41.2%.
Analysis: Despite not hitting our goal, I am very pleased with how this strategy played out. Our e-commerce conversion rate from referral increased to an impressive 9.73% (compared to 0.41% in 2013), and of course that is a better metric than just traffic. We will push harder for gift guides next year, and get started on them earlier.
How I know this: In the same Google Analytics Overview report, then just clicking on the “Referral” line to dive into that report.
Goal: Invest in social media advertising to increase conversions.
Result: Our traffic from social increased an impressive 435.7% and our e-commerce conversion rate increased 214%. The vast majority of both traffic and conversions came from Pinterest.
Analysis: Obviously the Pinterest increase is a huge win, and interesting because we didn’t put any marketing dollars there. We did advertise on both Facebook and Google, and hardly saw a bump from those advertising efforts. Next year we will double down on Pinterest and try advertising there instead.
How I know this: In the same Google Analytics Overview report, then just clicking on the “Social” line to dive into that report.
Goal: Keep drop ship account momentum going, which had increased 74.1% over 2013.
Result: During the holidays, our drop ship orders increased by 132.1%!
Analysis: We offered our drop ship accounts limited-time discounts on certain SKUs so that they would have styles to promote during the big shopping days like Black Friday and Cyber Monday. We also changed to shipping every day (rather than just Monday, Wednesday and Friday) so that they can offer more shipping days.
How I know this: In Quickbooks, I ran a report under “Manufacturing & Wholesale Reports” called “Sales by Customer Type” and filtered it for the “Drop Ship” type. Note: You have to be using the Quickbooks Premier: Manufacturing & Wholesale Edition to have access to this report. Another method would be to just compare sales from these accounts from one year to the other.
Overall I am very pleased with how the holiday sales turned out. It’s great to end the year on a high note and to sell through a lot of inventory. For 2016, I want to reduce the craziness by getting a headstart on some of these initiatives, especially pitching the gift guides and our social media campaigns earlier on.
If you had particular success with any of your holiday marketing strategies, please share in the comments below.
One of my favorite things about being in business for a few years is that you have a sales history that you can refer to when you are doing your planning. It sounds horribly geeky but having to guess about when, where and how you’re going to get sales is the absolute worst. Case in point: how much money can I hope to make this holiday season?
Like most consumer good companies, I hope Po Campo will cash in on all the holiday shopping activity. Below are our sales trends over the last two years. After a spring/early summer spike, you can see that the holidays are our second highest sales season. Our retail (i.e. B2C) sales have roughly doubled this year over last, and I’m banking on that trend continuing through December. Rather than just hoping for the best, I checked our data from last year to see what worked the best so that we can focus our efforts on activities with a high ROI.

First I look at our Quickbooks file to see where last year’s holiday sales came from and discovered that 78% came from retail sales, with the remainder being wholesale drop ship accounts.
Step One: How to Maximize Retail Sales
Focusing on the retail sales, about 30% of those came from doing holiday shopping events. We are doing several more shopping events this year, so I feel pretty confident that we’ll be able to roughly double that amount.
The rest of our sales came from our online store. To learn more about those sales, I looked at our Google Analytics acquisitions report for last year’s holiday shopping season to see where the highest converting traffic came from.

70% of our conversions came from people looking specifically for Po Campo, either typing pocampo.com into the URL bar or searching for Po Campo, or a variation of our name, in Google. My first thought is that these are people come to us already knowing what they want, so can I expect this number of visitors to double this holiday season?
To make an educated guess, I run a report comparing this year to last year. Our traffic is up by 56%, but our conversion rate is down by 19%. Therefore, if those trends continue through the holidays, I expect our organic and direct traffic to increase somewhat, but probably not double.
Next, 19% of our conversions came from referral traffic, mostly blogs that had included a Po Campo bag in some sort of gift guide. I know we are going to be included in some of the same gift guides this year, and it’s a little too late to make any more pitches. However, we have started some strategic partnerships with various groups, affiliate networks and analogous brands that should increase the amount of referral traffic we get.
Lastly, 7% of our sales came from social, almost entirely from facebook and Pinterest. Both of these platforms have greatly improved their targeting and reporting tools over the last year, so while I’m not able to glean much information about was successful last year, I think there is an opportunity to run some promoted posts to increase conversions this year.
Most of these tactics for pocampo.com are underway, with the exception of the facebook and Pinterest optimization. Researching that is now on my to-do list for next week.
Step Two: Drop Ship Accounts
Secondly, I ponder the drop ship accounts. Generally we just let them run on auto-pilot and focus most of our attention on our own online store. However, these drop ships have grown into a decent size business for us this year and I’d like to support them as they push for holiday sales as well. I brainstormed some promotion ideas with my team, including:
Knowing that time was of the essence, we sent these ideas to our contacts to get their input. As I feared, we were too late to be able to do much, especially with the larger sites. Not to let this lesson go to waste, I added a reminder to our 2015 calendar to look into this with our drop ship accounts in late September/early October instead.
Maximizing Holiday Sales Strategy
Here is what we still have time to do this year:
I look forward to sharing how successful we were in January! What are you planning for your last minute marketing push?
Running “Quickbooks Reports”
Po Campo uses the Wholesale and Manufacturing version of Quickbooks Premier. We set up our different revenue sources as Customer Types and these include: Retail, Drop Ship, Wholesale, Distributor and Discount. Running the “Sales by Customer Type” report (Reports > Wholesale & Manufacturing Reports > Sales by Customer Type) displays how your different revenues streams perform against each other over a period of time.
I didn’t discover this report until this year and now it is one of the ones I look at most often!
The first 6-7 months of 2012 were pretty good, as far as sales were concerned anyway. I went into August with a full calendar of trade shows and a new sales team, pretty certain that I’d end the year just as strong as I started it.
But, I was wrong. Sales in August, September and October were about half as much as I was planning on, which was pretty devastating. Then my sales manager left (along with much of my sales team) when it became clear she wasn’t equipped to handle the problem. Then several stores returned their bags because they weren’t selling. Then I found out that one of our most popular styles was defective and that some customers were dealing with returns of up to 30%. Then I got turned down for a loan (after I was approved no less!) and I had to stop paying myself.
Finally, today, three good things happened.
1) The University of Chicago Business School is including Po Campo as a project case in their Marketing Research class! That means I am going to have 5 MBA students working on Po Campo for an entire quarter! This is too good to be true. Knock on wood.
2) I stood up to my manufacturer. I’ve been told I’m waaaay too nice and understanding and need to toughen up and be more forceful with my manufacturing partner, otherwise I’m just going to continue to be docked around. I really gave her a piece of my mind today, and it felt darn good. My intern said I sounded “assertive”, which is definitely a step up.
3) After seeing our bottom line go farther and farther into the red the last few months, I rolled up my sleeves to dig deeper into the Quickbooks file to see if something was wrong. I mean, I know things are bad, but really this bad? Good news, I found some oddity in the file that was having the cost of goods on some items be double what they actually were. In other words, it was only showing half as much profit as there actually should’ve been. After figuring out how to correct it, I improved our bottom line by $20,000! Hallelujah! (And why didn’t my accountant catch this?)
I hope this means that I’ve turned a corner. I’ve noticed my optimism increase as well as my general jolliness. Times sure can get bleak around a small company, but finding the patience and strength to wait it out and/or pull yourself back up can be certainly rewarding.