I took a break from blogging but now I’m back. How funny that my last post featured a photo from Interbike, the now-defunct bike industry trade show. There’s a lot of explanations swirling around about why Interbike is no more (or, at least, taking a break), but I think a big reason is because it didn’t represent a scene that a lot of people wanted to be a part of. I know that’s largely why I stopped attending.
The lapse of Interbike brings me to a question I get asked a lot – do I do trade shows, and do I think they’re worthwhile? I’ve decided that they’re not the best use of Po Campo’s money, so we’re not doing any this year, but depending on your product and industry, they might be right for you.
I grew up in a middle class family, but we were very frugal. Creatively reusing things and figuring out how to save money was our way of life. Discovering that you overpaid for something was shameful, as was buying something you didn’t need. We would scoff at the idea of buying name-brand things. “Don’t they know that such-and-such is the same exact thing for half the price?” we’d say, shaking our heads at the thought of such foolishness.
Yep, social media can be an awesome, inexpensive and fun way to connect with current and potential customers and their communities. It can also be an excellent way to waste a lot of time and money. Are you wondering if your social media efforts are paying off? Here’s my method for how to measure social media for free (and not just for a first 30 day trial period either).
In the old days, people were obsessed with growing their fans and followers above all else. Times have changed, as we’ve learned that those metrics are not a good indicator of how well you’re connecting with your audience. Rather than counting how many fans you have or how often you are posting, pay attention to your engagement rate. Engagement is how often people interact with your content, either by liking it or sharing it or commenting on it.
The engagement rate is a blend of likes/comments/shares, but at Po Campo we break it down to look at each action separately. This takes more effort, but it sheds light on how the different platforms behave and helps you understand what to do to up your game in each space.
The Engagement Rate can be broken down into:
Conversation Rate (Comments per post)
Amplification Rate (Shares per post)
Applause rate (Likes per post)
I used Facebook terminology, but all social media platforms have their equivalents. For example, on Twitter, Conversation = replies, Amplification = re-tweets, and Applause = favorites.
Screenshot from TrueSocialMetrics, courtesy of Moz
However, TrueSocialMetrics is not free; their most basic package is $30/month. While not terribly expensive, those monthly costs really add up, so I wanted to compare how much it would cost to do the same measurements internally. After devising this method on how-to measure social media, I found out that we could do it once a month for half the cost. Once a month is a frequency that works for us because, well, we’ve got other things to do besides just measuring social media.
In devising our own system, I added a few more metrics:
Click-Through Rate, since one of our social media goals is to increase web traffic
Relative Engagement Rate, to compare how active each follower is on each platform
Economic Value Rate, to see how much money each social media platform brings in
Access this temple on Google Docs and start measuring your social media efforts today.
I created a template on Google Docs for you to use. It consists of two worksheets:
The first tab is a worksheet where you enter your data in the top portion and the rates are automatically calculated below. We do this on the first day of the month. In my example above, you can immediately see which platforms are performing better across the different metrics: Facebook is great for conversations and sharing, Pinterest users are more engaged, Instagram gives us the loudest “applause”, meaning our content there is resonating well. Our Twitter account obviously is lacking across all metrics. I’ll dig deeper into what to do with these learnings in a separate post, but I bet you already have some ideas.
The second is a worksheet that calculates your month over month improvement. I meet with my social media team member in the beginning of each month to review our numbers and to identify what is working well and what needs some help.
Your next question is probably where to find the numbers to populate the top part of the “How-To Measure Social Media” table. Well, here you go! Below is how to find your data, platform-by-platform, using completely free services. Once you do it once, it’ll become quicker, I swear.
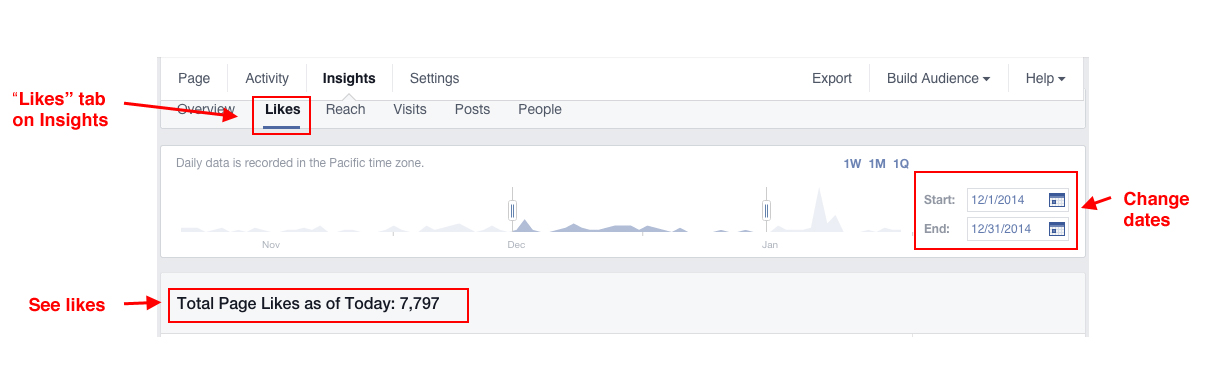
Go to your Facebook page’s Insights panel and click on Likes tab.
Update dates at right side
See total likes beneath graph
# of Posts / Comments / Shares / Likes
This one unfortunately isn’t as straightforward because Facebook Insights shows you the average amount of comments/shares/likes that your posts received, not the totals, which are needed to calculate the rate. I prefer the rate over the average so you know how effective your posts are. If you can accomplish the same results with 20 posts instead of 200, that is a better use of time, and only the rate gives you that information.
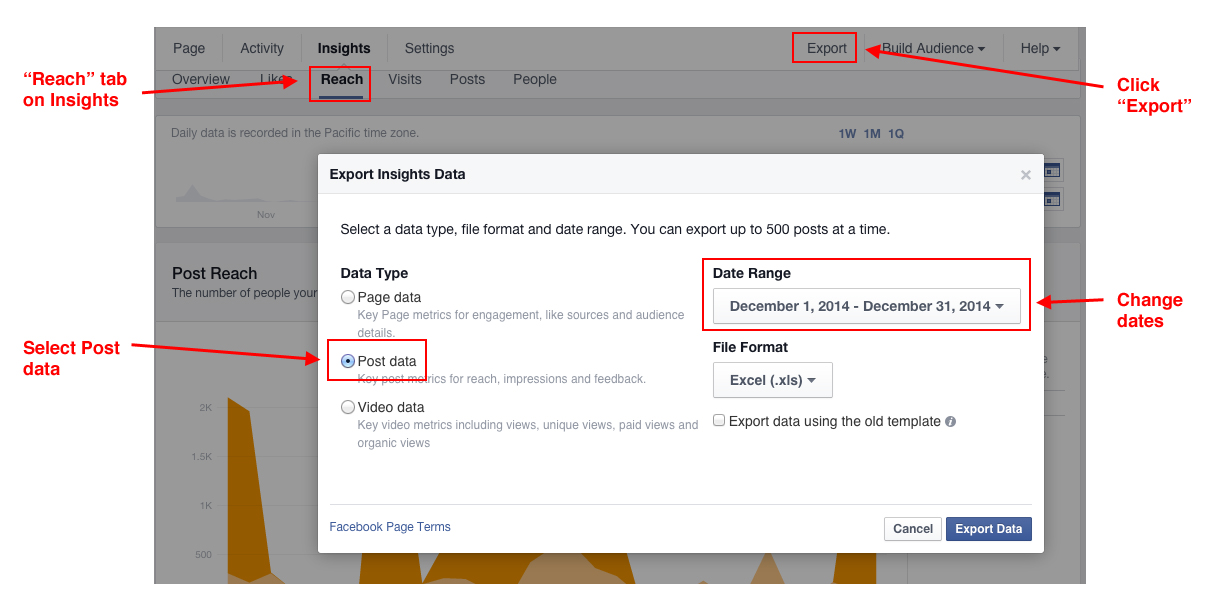
Go to your Facebook page’s Insights panel and click on Reach tab and click Export.
Change dates in pop-up window and select the “Post Data” report
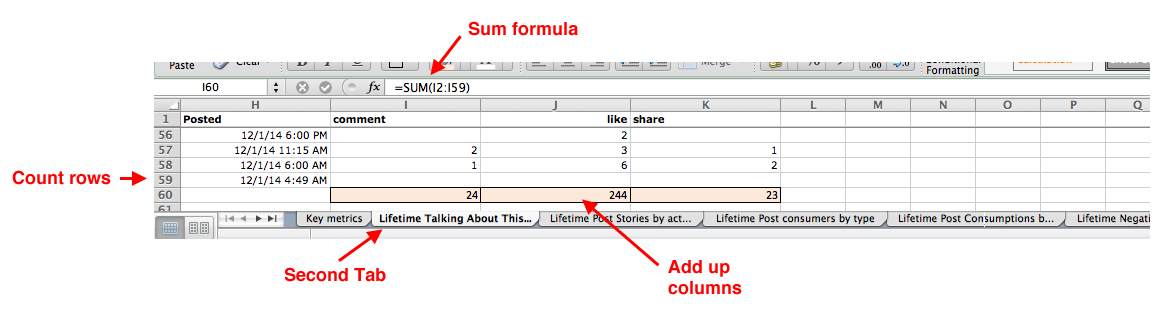
Open the report in Excel and try not to feel overwhelmed. Navigate to the second tab titled “Lifetime: The number of unique people who created a story about your Page post by interacting with it. (Unique Users)”.
See how many rows there are and subtract by two so as to not count the headers. This is your # of Posts value.
Add up the values in Columns I, J and K (comment, like and share, respectively) to get those values.
Step 1: Exporting the data for your posts
Step 2: Open data and add up your values
# of Clicks to Website & Total Revenue
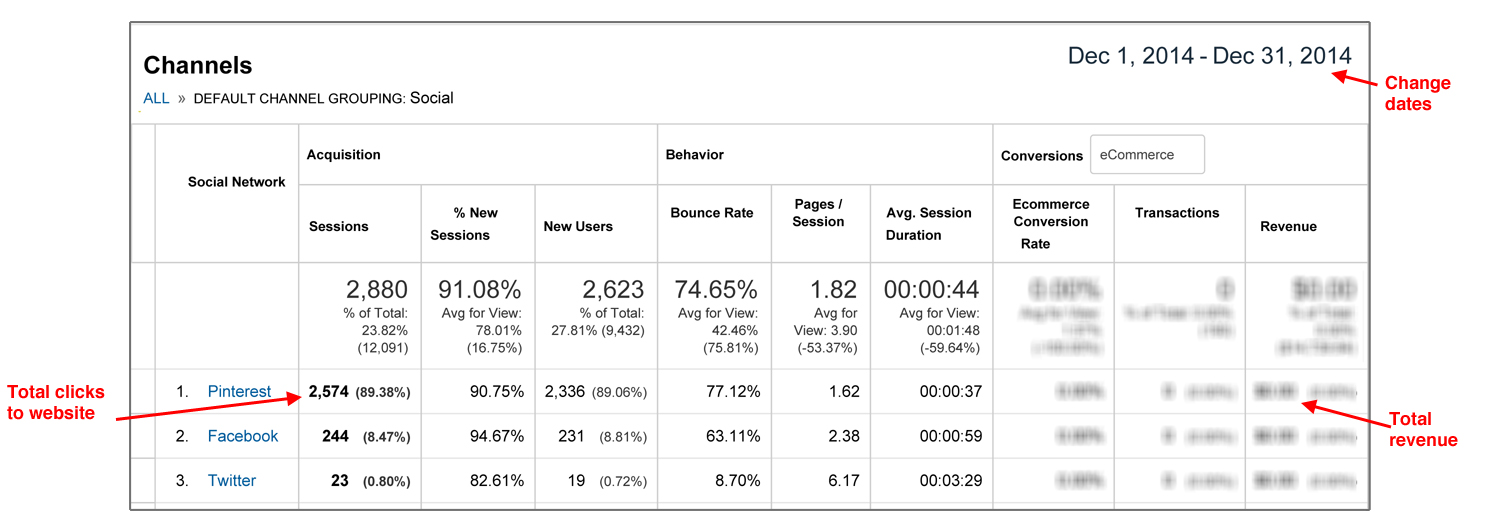
These last two values can be found in Google Analytics. You need to check both the “Social” channel and “(Other)” channel, as traffic from smartphone apps sometimes shows up in the latter.
In Analytics, go to Acquisition > All Traffic > Channels and change the date at top.
Click on Social to see traffic coming directly from the social media sites. Write down the total number of sessions (clicks to website) and total revenue.
Go back to the Channels report and click on (Other) to see more traffic from those platforms that came to your site from a different app. Again, write down the sessions and total revenue from each channel.
Add the values from #2 and #3 together and put them in the worksheet.
Twitter You’ll need to set-up a free Twitter analytics account to access these reports.
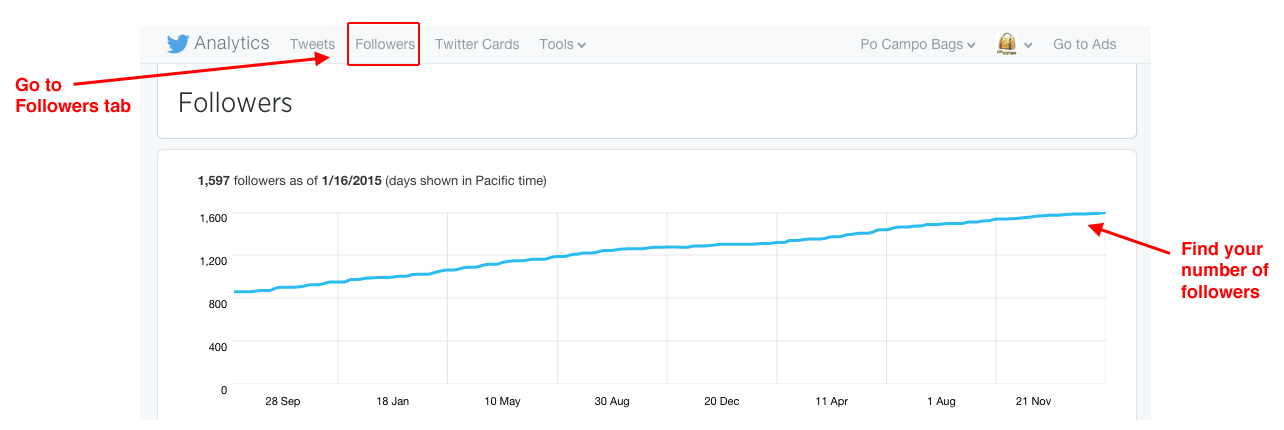
# of Followers
In your Twitter Analytics page, go to “Followers” tab
Find your number of followers on a particular date on the bar graph.
# of Posts / Replies / Retweets / Favorites
Similar to Facebook, Twitter Analytics makes it easy to see the averages but difficult to see the totals. You have to download the data and add it up in Excel.
In Twitter Analytics, go to “Tweets” tab and click “Export Data”. This can take awhile because it exports ALL your data.
Once opened in Excel, copy the rows of tweets that were posted in your time period and paste into a new worksheet. (This is optional, just makes it easier to work with).
Count the number of rows to get your # of Posts value.
Similar to the facebook data above, add the values in column H, I, J to get your total Retweets, Replies, and Favorites, respectively.
# of Clicks to Website & Total Revenue
These last two values can be found in Google Analytics, same as above.
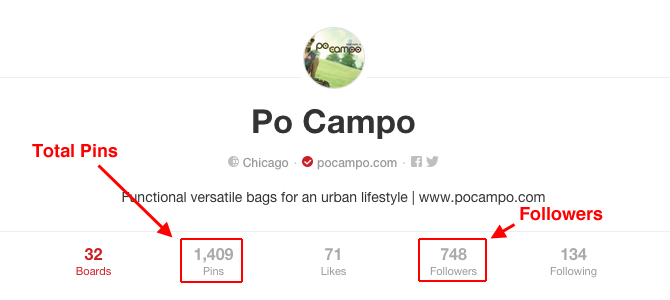
Your # of followers can be found on your main profile page. There is no way to find it back-in-time, so just be diligent about recording this number on the last day of the month.
There’s no way to see how many new pins you posted during the time period, but pins tend to live on longer on Pinterest anyway. Therefore, we record the total # of our pins on all of our boards for this metric.
# of Repins / Likes
Once again, you have to download the raw data to be able to count these metrics, as Pinterest analytics only gives you the averages for a certain time period. The raw data only shows you your top pins, not everything, but I’ve found this to be workable. Sadly, Pinterest Analytics does not offer a “comment” metric, so we are unable to determine the conversation rate for this platform.
In Pinterest Analytics, go to Your Pinterest Profile tab and select the Impressions option. Change the date and then click “Export”.
Similar to the facebook data above, in the”Top Pin impressions” section, add the values in column G & H to get your total number of repins and likes.
# of Clicks to Website & Total Revenue
These last two values can be found in Google Analytics, same as above.
Instagram Instagram does not offer its own analytics yet. We use a free account on Iconosquare for these basic metrics. Most of their statistics are on a rolling monthly basis, so it’s best to be diligent about getting these numbers on the last day of your recording period. Since Instagram does not really have a “Share” option, we skip the Amplification rate for this medium.
# of Followers
Navigate to the “Statistics” tab in Iconosquare. Your number of followers is on the main Overview page.
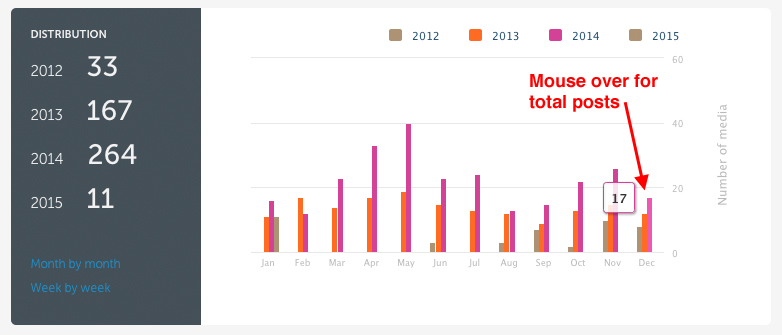
# of Posts
Click on “Content” on the left side. Your # of our posts during each month are visible in the Distribution graph.
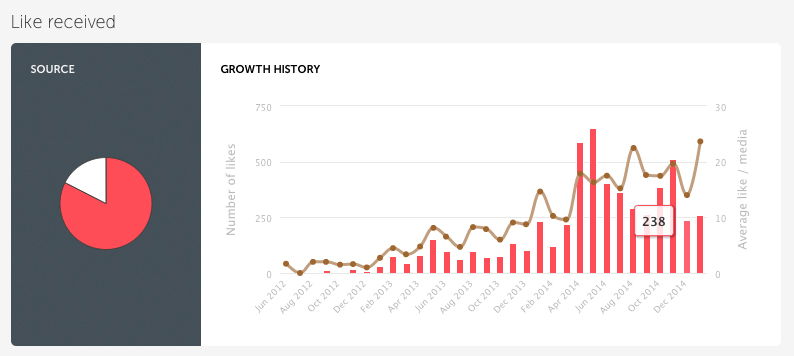
# of Likes / Comments
In Iconosquare, click on “Engagement” on left side. In the “Like Received” graph, mouse over the bar for the month to see the total number of likes.
For Comments, do the same thing on “Comment Received” graph.
# of Clicks to Website & Total Revenue
These last two values can be found in Google Analytics, same as above. Instagram traffic will most likely show up only on the “(Other)” channel, for whatever reason.
Now that you know where to find your measurements, and what to do with them (put them in my Measuring Social Media table!), I look forward to hearing about your insights. If you have better tools, please share, especially if they are free. It seems like most services are built for agencies managing multiple brands or big brands with big budgets, and not too much for us little guys. That’s why this DIY method seems like the best option for right now.
My post “How I Plan to Maximize Holiday Sales” from 11/18/14 outlined my strategy for cashing in on the holiday shopping season. Are you curious about how my plans worked out? Now that the dust has settled, I checked to see how well we did.
I pulled these reports with Quickbooks and Google Analytics. Details on how to do so are in each metric.
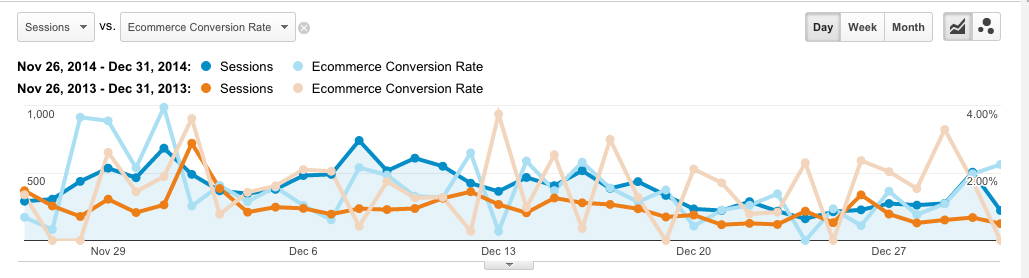
Google Analytics Acquisition>All Traffic>Channel report, comparing 2014 (Blue) against 2013 (Orange). This report shows Sessions (aka Traffic) and E-Commerce Conversion Rate.
Overall Goal: Double sales over 2013 Result: Overall sales increased by 87.2%. So not quite double, but pretty close. Analysis: Of course it always burns a bit to not quite hit your goal, but overall I am happy with how the season turned out. How I know this: In Quickbooks, I ran a Profit & Loss Statement (P&L) for the holiday time period and compared 2014 against 2013.
Goal: Double retail event sales by doing many more events Result: Event sales increase by 98.7%. Hurray! Again, not quite the goal, but pretty darn close. Analysis: We did a whopping 8 events (as opposed to just one in 2013), and that strategy obviously worked. That said, we were all pretty exhausted by the end of the month. Next year we’ll skip some of the slower shows and enlist more volunteers so we aren’t working seven days a week. How I know this: In the same P&L statement from above, I filtered it for our “Retail Events” customer. We didn’t set-up a Retail Events customer until midway through 2014, but since we use Square for credit card transactions at events, I was able to figure out the 2013 sales with a Square sales report.
Goal: Maintain the momentum of increased traffic to our website by 56% over 2013 Result: Traffic increased by 62.3%. Analysis: I attribute the extra bump in traffic to just more people being online and shopping. How I know this: In the Google Analytics Acquisition Overview report, I compared 2014 against 2013. I refer to “Sessions” to represent inbound traffic.
Goal: Increase referral traffic by roughly 50% by being in more gift guides Result: Referral traffic increased by 41.2%. Analysis: Despite not hitting our goal, I am very pleased with how this strategy played out. Our e-commerce conversion rate from referral increased to an impressive 9.73% (compared to 0.41% in 2013), and of course that is a better metric than just traffic. We will push harder for gift guides next year, and get started on them earlier. How I know this: In the same Google Analytics Overview report, then just clicking on the “Referral” line to dive into that report.
Goal: Invest in social media advertising to increase conversions. Result: Our traffic from social increased an impressive 435.7% and our e-commerce conversion rate increased 214%. The vast majority of both traffic and conversions came from Pinterest. Analysis: Obviously the Pinterest increase is a huge win, and interesting because we didn’t put any marketing dollars there. We did advertise on both Facebook and Google, and hardly saw a bump from those advertising efforts. Next year we will double down on Pinterest and try advertising there instead. How I know this: In the same Google Analytics Overview report, then just clicking on the “Social” line to dive into that report.
Goal: Keep drop ship account momentum going, which had increased 74.1% over 2013. Result: During the holidays, our drop ship orders increased by 132.1%! Analysis: We offered our drop ship accounts limited-time discounts on certain SKUs so that they would have styles to promote during the big shopping days like Black Friday and Cyber Monday. We also changed to shipping every day (rather than just Monday, Wednesday and Friday) so that they can offer more shipping days. How I know this: In Quickbooks, I ran a report under “Manufacturing & Wholesale Reports” called “Sales by Customer Type” and filtered it for the “Drop Ship” type. Note: You have to be using the Quickbooks Premier: Manufacturing & Wholesale Edition to have access to this report. Another method would be to just compare sales from these accounts from one year to the other.
Overall I am very pleased with how the holiday sales turned out. It’s great to end the year on a high note and to sell through a lot of inventory. For 2016, I want to reduce the craziness by getting a headstart on some of these initiatives, especially pitching the gift guides and our social media campaigns earlier on.
If you had particular success with any of your holiday marketing strategies, please share in the comments below.
In mid-November, I was working on Po Campo‘s marketing plan for 2015 and realized it was largely based upon who we thought our customer was and what we thought she thought about us. We have a lot in the pipeline, both as far as new product development and marketing plans go, and I felt like it was time for gut-check with our customers to make sure we were on the same page.
Determining Objectives & Questions
I decided an online survey would be the easiest way to quickly check-in with our current and potential customers. From my past experience as a design researcher, I know that having concise objectives is key to a successful study. Using SurveyMonkey.com ($19/month for basic), I built a survey around answering the following questions:
We think of our customers as mostly active, urban minded women between 25 and 45 who live in bike friendly communities. Is that true?
We think “women-run”, “design-led” and “inventive combinations of style and function” are the brand attributes that resonate strongest with our customers. Is that true?
We’re developing yoga, baby and lifestyle bags and exploring wearables. Do we have license from our customers to stretch our brand into these areas?
I ended up designing a twenty-two question survey, which included a few more questions than necessary to answer the above objectives but it’s hard to resist the temptation of asking people things that you’ve been wrestling with while you have their attention. For me that included getting clarification on whether they see Po Campo as more of a bike, fitness or lifestyle brand to help us sort out our chaotic retail strategy and which brand archetype best suits us to help us determine tone of voice.
Insights from the Survey We had 624 total respondents, mostly recruited through our newsletter list (88%) and Facebook (12%). Most respondents were existing customers (66%), while 30% were potential customers, in that they didn’t own a Po Campo product but were familiar with what we do.
For the first two objectives above, our assumptions were pretty accurate. We did learn that women value that Po Campo is a women-run business much more than men do, while men value that we are design-led much more than women do. That learning kind of plays into the stereotypes of men and women but so be it.
The answer to the third objective gave me pause: the majority of both our current and existing customers will probably not be purchasers of most of our new products as they do not engage in the activities we are designing for. On one hand, this is okay, because we can expand our pool of potential customers; on the other hand, marketing to a whole new group of people will be a lot of work.
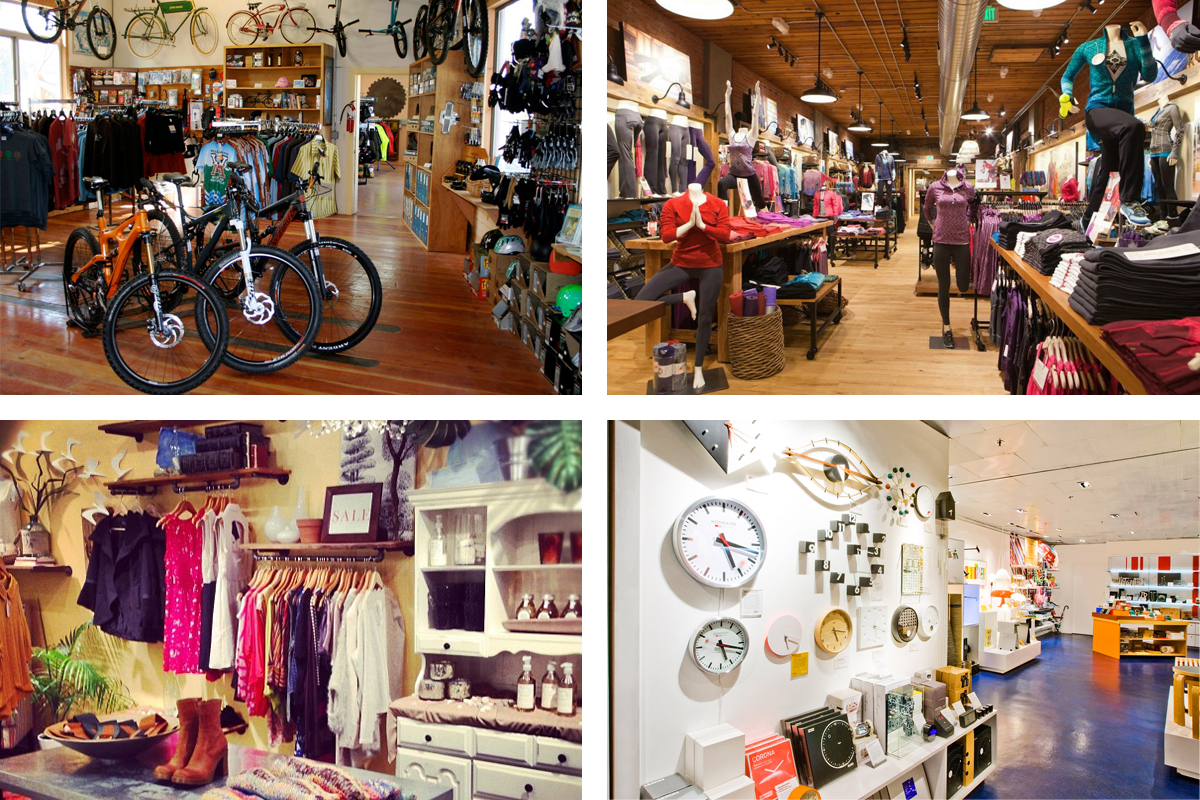
Learnings from our secondary objectives were even more insightful as they challenged my existing perceptions of our brand. When asked what type of store environment would be the best fit for Po Campo, the majority of people (69%) chose either a bike store or a Athleta-type fitness store. The lifestyle boutique and designerly gift shop were much less popular answers, with 14% and 11% respectively. I always kind of thought of us as more of a boutique brand but our audience clearly has us in a more athletic context.
“Which of these store environments would be the best fit for Po Campo?”
To help us determine our brand archetype, I asked a fill-in-the-blank question that said “When I think of Po Campo, I picture a brand that is all about…”. The clear winner to this question was the response that said “…being down-to-earth, reliable and trustworthy”, the answer that represented the “everyperson” archetype. I always thought of Po Campo as the Explorer archetype so this was something new. In researching the Everyperson, it does make a lot of sense to me, and has helped me understand the role we play in our customers’ lives better.
Action Steps Analyzing research without laying out steps of action is a missed opportunity. Based on our research, this is what I will do next:
Research the new markets we plan to enter to confirm that our offering fills a need and is differentiated from existing products and brands. If it is, develop a marketing plan for each of the new product launches.
Revisit our marketing plan and focus it in on “active healthy living”.
Revisit marketing plan to focus on telling the “women-run” part of our story better, especially for content targeted to women.
Click here to see the complete survey. Please note that logic was included in the survey, so not all people saw all questions.
Have you conducted any surveys lately? What tips do you have to share?
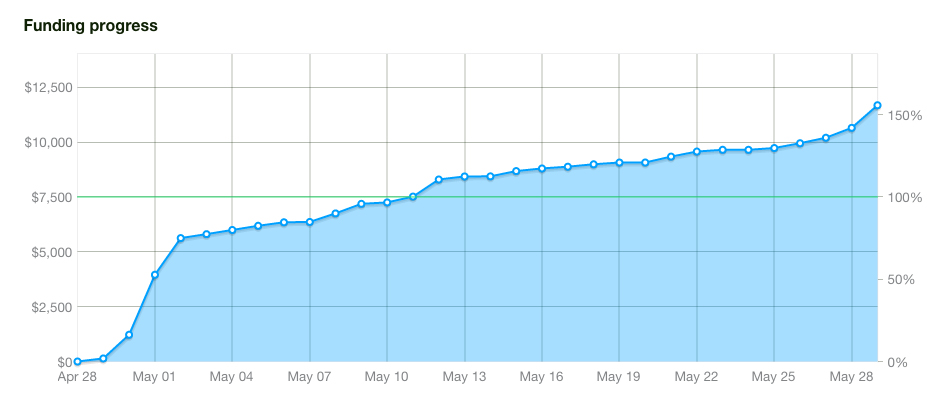
Po Campo ran a Kickstarter for our Bike Share Bag in May of 2014. We met our goal in the first two weeks and ended up surpassing our goal by 56%, which was great. But it was a ton of work!
Background on why we did it
In October 2013, I started working on a bag to fit into the front basket of the bike share bikes in Chicago and New York, and other cities, to help you carry more stuff while riding, enabling you to use the bikes for more types of trips.
We were planning on launching the bag in May/June to take advantage of as many of the summer riding months as possible. In late February, I shot a video of the bag to share with the various bike share systems to see if they’d be willing to help me market it to their members. We decided to post the video to our Facebook page because we needed some content that day and a bunch of people saw it and shared it. Then the Huffington Post wrote about it, followed by several other publications.
So, here we were getting this great buzz in March but not being able to sell the bag until June. I wanted to do something to keep the momentum going, and doing a Kickstarter seemed like just the ticket.
In addition to piggy-backing on the media coverage, I thought Kickstarter could help us reach a new audience. Po Campo’s audience is mostly female, but bike share riders are mostly male, so effectively selling the bag would mean getting access to a more male audience. Kickstarter’s traffic is 72% male.
Plus, I had been feeling like Po Campo needed to do a Kickstarter for awhile, mostly because it seemed like every cool product company had done one and we hadn’t. I am aware that that isn’t a good reason but there you have it.
How we prepared for the campaign May is National Bike Month, so we wanted to take advantage of that and run the campaign during May, thinking that the media would already be actively looking for bike stories that month. That gave us a little over a month to prepare.
According to Kickstarter stats, projects looking to raise between $1,000 and $10,000 are most likely to succeed. I chose a goal of $7,500, which was about 50% of the costs of the production run. I really wanted to make our goal and not stress too hard about it, and this seemed like a feasible amount. I knew I’d be able to cover the rest of the production cost with cash flow from the core Po Campo business.
Here’s what we did to get ready:
Added a “wait list” to our website to capture people who came looking for the bag after the Huffington Post article. I wanted to sell 25 bags the first day to these people, and figured we’d need at least 100 people on the waiting list to do so.
Scripted the video and recruited Sara Potts of Lady Lens Productions to produce the movie. The video took about 4 weeks to complete, from start to finish.
Brainstormed backer reward ideas and reached out to simpatico brands to collaborate with (most of these partnerships were scrapped for fear that Kickstarter wouldn’t accept our project).
Connected with all the bike share systems to tell them what we were doing and pitched ways they could help promote it.
Made a list of “influentials” in the bike share community and reached out to them to see if they’d be willing to take a photo with the bag.
Combed through our media list to identify journalists that seemed to be a good audience for our story and put a pitch together.
Made a week-by-week plan about which aspect of our project we would focus on each week to try and keep it fresh.
How Kickstarter became a time-suck In the 4-5 weeks leading up to the campaign, I devoted about a third of my time working on it, or at least thinking about it. That’s a lot, considering our Kickstarter goal was just 2% of our projected sales for 2014. There’s just something about Kickstarter that demands a lot of your attention.
I thought that once we hit the “go” button that we’d be able to just relax and execute our plan, but that’s not what happened. Our campaign had a familiar curve, with a big spike the first few days and then slow growth after that.
Our Kickstarter Funding Progress
I hadn’t anticipated how exhilarating those first few days would be and how you spend the rest of the campaign trying to recapture that thrill. Every day I would try to think of more people to ask to become a backer of the project, or to at least share it with others. I would go to every event and networking opportunity I could think of with the bag in tow to tell people about what we were doing. I probably continued to spend a third to a half of my energy on the campaign, which is ill-advised. It was like I was in a Kickstarter vacuum and everything else came to a standstill.
What I would do differently next time
First, I would NOT make my email address the destination for all the notifications. Getting the emails of new backers would get me too excited, while a lull in new backers would bum me out. One can not effectively run a business when on an emotional roller coaster like that.
Second, I would start the planning and media pitching much earlier, maybe six months in advance, so as to not scramble during the campaign. Like all marketing, it always surprises me how many people you have to tell to get any traction at all.
Lastly, I would choose a project that was newer for us, or something that challenged us more, where we could invite our backers along with us on the journey. I felt like we were still just making a bag – I mean, a really cool bag – but nothing too different from what we had done before. Candid updates from the Kickstarter creator are some of the best aspects of backing a project, but because our process for making bags was already pretty established, it was hard for us to make this process very exciting.
If you’ve done a Kickstarter project, was your experience similar to mine? Share in the comments!
I started blogging about my experience of building Po Campo three years ago but I only began regularly posting this past summer. I usually base the topic on something that I’m presently focused on, whether that be grandiose big picture things or nuts-and-bolts executional things. As far as I’m concerned, it’s all fair game and all part of the entrepreneur’s life.
Well, this weekend I drew a blank on what to write because I spent the last week doing little other than being overwrought about how much we would sell between Black Friday and Cyber Monday. I wish I could tell you how I managed to overpower the anxiety in the end, but I can’t, because I haven’t. However, I am going to hold true to the promise I made to myself to post every week, which means that while anxiety about Christmas sales is not the most interesting topic, I suppose I will just have to write about that, because it’s all I can seem to think about.
The core of my anxiety is that our December sales need to be good to end the year with a profit, a goal that has eluded me for the last five years. In addition to just making me feel like I am doing a good job at running my business, being profitable would increase my likelihood of getting a bank loan, or some other kind of financing, so I could start to improve my balance sheet. There’s nothing I’d like more than being able to pay back some of those early friend and family loans that make me feel guilty and some of that high interest credit card debt that just makes me feel like a loser.
I put together a solid holiday marketing strategy to hit our sales goals, but that has apparently done little to assuage my anxiety. When I’m in a state like this, I feel paralyzed by my inability to control the outcome of a situation, and so I sit around watching movies until an idea strikes me (Change up the card abandonment email! Reactivate the Google remarketing ads! Think of another clever facebook post – and boost it!), in which case I jump up and do that post haste. I don’t feel like there is time to do the things that normally help me feel balanced, like yoga or cooking or socializing, because I feel too busy, when in reality I’m just waiting…for something.
December 13 Update
Holiday sales are going splendidly, thank you very much. Our last shipping day is Dec 19, which means by this time next week, I’ll be ready to sit back, relax, and enjoy the rest of the holiday season!
One of my favorite things about being in business for a few years is that you have a sales history that you can refer to when you are doing your planning. It sounds horribly geeky but having to guess about when, where and how you’re going to get sales is the absolute worst. Case in point: how much money can I hope to make this holiday season?
Like most consumer good companies, I hope Po Campo will cash in on all the holiday shopping activity. Below are our sales trends over the last two years. After a spring/early summer spike, you can see that the holidays are our second highest sales season. Our retail (i.e. B2C) sales have roughly doubled this year over last, and I’m banking on that trend continuing through December. Rather than just hoping for the best, I checked our data from last year to see what worked the best so that we can focus our efforts on activities with a high ROI.
Po Campo’s sales history over the last two years
First I look at our Quickbooks file to see where last year’s holiday sales came from and discovered that 78% came from retail sales, with the remainder being wholesale drop ship accounts.
Step One: How to Maximize Retail Sales
Focusing on the retail sales, about 30% of those came from doing holiday shopping events. We are doing several more shopping events this year, so I feel pretty confident that we’ll be able to roughly double that amount.
The rest of our sales came from our online store. To learn more about those sales, I looked at our Google Analytics acquisitions report for last year’s holiday shopping season to see where the highest converting traffic came from.
Po Campo’s converting traffic from last holiday season (Nov 15 – Dec 31)
70% of our conversions came from people looking specifically for Po Campo, either typing pocampo.com into the URL bar or searching for Po Campo, or a variation of our name, in Google. My first thought is that these are people come to us already knowing what they want, so can I expect this number of visitors to double this holiday season?
To make an educated guess, I run a report comparing this year to last year. Our traffic is up by 56%, but our conversion rate is down by 19%. Therefore, if those trends continue through the holidays, I expect our organic and direct traffic to increase somewhat, but probably not double.
Next, 19% of our conversions came from referral traffic, mostly blogs that had included a Po Campo bag in some sort of gift guide. I know we are going to be included in some of the same gift guides this year, and it’s a little too late to make any more pitches. However, we have started some strategic partnerships with various groups, affiliate networks and analogous brands that should increase the amount of referral traffic we get.
Lastly, 7% of our sales came from social, almost entirely from facebook and Pinterest. Both of these platforms have greatly improved their targeting and reporting tools over the last year, so while I’m not able to glean much information about was successful last year, I think there is an opportunity to run some promoted posts to increase conversions this year.
Most of these tactics for pocampo.com are underway, with the exception of the facebook and Pinterest optimization. Researching that is now on my to-do list for next week.
Step Two: Drop Ship Accounts
Secondly, I ponder the drop ship accounts. Generally we just let them run on auto-pilot and focus most of our attention on our own online store. However, these drop ships have grown into a decent size business for us this year and I’d like to support them as they push for holiday sales as well. I brainstormed some promotion ideas with my team, including:
Developing content that they can just plug into their networks. Our expertise is in inventive and inspired products for modern city living, in particular integrating the bicycle into your life, and this is something we’d be happy to share with them.
Using our reflector pins as a gift with purchase (commonly called GWP) during certain periods.
Offering longer return periods
Offering special promotions
Knowing that time was of the essence, we sent these ideas to our contacts to get their input. As I feared, we were too late to be able to do much, especially with the larger sites. Not to let this lesson go to waste, I added a reminder to our 2015 calendar to look into this with our drop ship accounts in late September/early October instead.
Maximizing Holiday Sales Strategy
Here is what we still have time to do this year:
Promote the heck out of the holiday events we have planned this year
Activate our Google Adwords that target the common misspellings of our name (like Pro Campo or pocampo) and turn on our remarketing ads to make sure we stay top of mind to people who visit our site.
Increase traffic from facebook and Pinterest
Promote the gift guide exposure
Identify partner marketing opportunities with our simpatico brands
Continue to talk with drop ships about highlighting Po Campo
I look forward to sharing how successful we were in January! What are you planning for your last minute marketing push?
Running “Quickbooks Reports”
Po Campo uses the Wholesale and Manufacturing version of Quickbooks Premier. We set up our different revenue sources as Customer Types and these include: Retail, Drop Ship, Wholesale, Distributor and Discount. Running the “Sales by Customer Type” report (Reports > Wholesale & Manufacturing Reports > Sales by Customer Type) displays how your different revenues streams perform against each other over a period of time.
I didn’t discover this report until this year and now it is one of the ones I look at most often!
Of all the types of marketing that we do at Po Campo, email marketing is probably the most successful in terms of ROI. Our e-commerce conversion rate for newsletters is 1.49%, the highest of all our marketing efforts. Our newsletter subscribers may only account for about 4% of our website traffic, but over 8% of our conversions, so they’re active and engaged visitors too.
Building Your Newsletter List We get about $17 in sales from each newsletter for every hundred people on our list. Naturally, the more people on our list, the more sales we can expect. That’s why growing the list is always a priority. Focus on growing your list organically rather than purchasing or trading lists so that it remains high quality, resulting in higher sale conversion rates.
The two most successful ways we build our newsletter list involve, unsurprisingly, giving things away for free.
1) Offering something irresistible. Try a couple offers (called a “lead magnet”) before figuring out what your customers like. Before offering a $50 gift card to one lucky new subscriber each month, we tried free content about tips for city biking and a free $5 on your first purchase. The bigger sweepstakes of a free $50 worked best for us. We get an average of 65 new sign-ups each month once we started this practice. Read more on lead magnets here.
2) We offer a free reflector pin (value of $5) in exchange for an email address at all of our events. Few people can resist the pin, plus they don it almost immediately and then other people ask where they got it from and are directed our way. We can get upwards of 200 emails a day at busy events.
Maintaining Your List
The obvious goal is to send people emails that they enjoy receiving so as not to unsubscribe. You’d think that sales/promotion emails are the best, but while those probably generate the most immediate sales, we have found general lifestyle topics, company updates, tips and how-tos to have the lowest unsubscribe rate.
Po Campo sends an email about every other week on Thursdays. Creating an email marketing calendar ahead of time reduces the “So what do we write about this week???” syndrome, which almost always results in boring emails. By creating a calendar, you can make sure that your sales are spread out throughout the year and that you are maximizing the content that you are creating elsewhere (e.g. for your blog or for Facebook). Our average open rate is 30.1% and click through rate is 6.9%, which are both above average (17.35% and 3.0% respectively, according to MailChimp benchmarks).
Discouraging Unsubscribes About .6% of our newsletter list unsubscribes with each email. That’s not super high but of course I wish it were zero. Recently I did two things to curb the unsubscriber activity, or at least to not lose touch with them altogether.
1) An option to receiver fewer emails. I know sometimes I open my inbox and go on a major unsubscribe binge, removing myself from pretty much every newsletter just because I’m sick of receiving them and having to devote energy to them. Of course many of our subscribers unsubscribe because of a similar feeling, not that they don’t ever want to hear from us ever again but because we were just one more email that day.
Hoping that we could keep people subscribed if we gave them an option to receive fewer emails, I created a group in MailChimp called “Newsletter Types”with three sub-groups:
“All, including tips and how-to’s, event announcements, sales, and new product debuts”
“Just Sales/Promotions (about 6 times per year)”
“New Product Announcements (about 4 times per year)”
Now, when people go to unsubscribe, we allow them to update their profile and change their newsletter frequency preference.
2) Ask to connect another way. I think most of us have email fatigue and prefer interacting with brands on different mediums, like facebook or Instagram. On our unsubscribe confirmation page, we ask one last time if they would consider connecting with us on one of our social networks, so as not to lose touch with them completely.
I hope this inspires you to build and maintain a healthy newsletter list. Do you have strategies beyond what we’re doing to do so? Please share in the comments!