My post “How I Plan to Maximize Holiday Sales” from 11/18/14 outlined my strategy for cashing in on the holiday shopping season. Are you curious about how my plans worked out? Now that the dust has settled, I checked to see how well we did.
I pulled these reports with Quickbooks and Google Analytics. Details on how to do so are in each metric.
Overall Goal: Double sales over 2013
Result: Overall sales increased by 87.2%. So not quite double, but pretty close.
Analysis: Of course it always burns a bit to not quite hit your goal, but overall I am happy with how the season turned out.
How I know this: In Quickbooks, I ran a Profit & Loss Statement (P&L) for the holiday time period and compared 2014 against 2013.
Goal: Double retail event sales by doing many more events
Result: Event sales increase by 98.7%. Hurray! Again, not quite the goal, but pretty darn close.
Analysis: We did a whopping 8 events (as opposed to just one in 2013), and that strategy obviously worked. That said, we were all pretty exhausted by the end of the month. Next year we’ll skip some of the slower shows and enlist more volunteers so we aren’t working seven days a week.
How I know this: In the same P&L statement from above, I filtered it for our “Retail Events” customer. We didn’t set-up a Retail Events customer until midway through 2014, but since we use Square for credit card transactions at events, I was able to figure out the 2013 sales with a Square sales report.
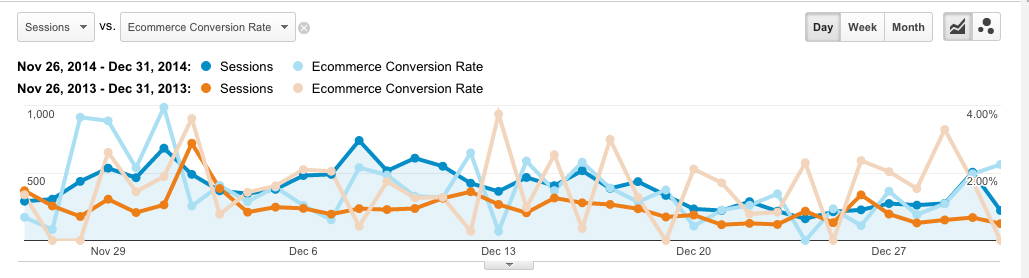
Goal: Maintain the momentum of increased traffic to our website by 56% over 2013
Result: Traffic increased by 62.3%.
Analysis: I attribute the extra bump in traffic to just more people being online and shopping.
How I know this: In the Google Analytics Acquisition Overview report, I compared 2014 against 2013. I refer to “Sessions” to represent inbound traffic.
Goal: Increase referral traffic by roughly 50% by being in more gift guides
Result: Referral traffic increased by 41.2%.
Analysis: Despite not hitting our goal, I am very pleased with how this strategy played out. Our e-commerce conversion rate from referral increased to an impressive 9.73% (compared to 0.41% in 2013), and of course that is a better metric than just traffic. We will push harder for gift guides next year, and get started on them earlier.
How I know this: In the same Google Analytics Overview report, then just clicking on the “Referral” line to dive into that report.
Goal: Invest in social media advertising to increase conversions.
Result: Our traffic from social increased an impressive 435.7% and our e-commerce conversion rate increased 214%. The vast majority of both traffic and conversions came from Pinterest.
Analysis: Obviously the Pinterest increase is a huge win, and interesting because we didn’t put any marketing dollars there. We did advertise on both Facebook and Google, and hardly saw a bump from those advertising efforts. Next year we will double down on Pinterest and try advertising there instead.
How I know this: In the same Google Analytics Overview report, then just clicking on the “Social” line to dive into that report.
Goal: Keep drop ship account momentum going, which had increased 74.1% over 2013.
Result: During the holidays, our drop ship orders increased by 132.1%!
Analysis: We offered our drop ship accounts limited-time discounts on certain SKUs so that they would have styles to promote during the big shopping days like Black Friday and Cyber Monday. We also changed to shipping every day (rather than just Monday, Wednesday and Friday) so that they can offer more shipping days.
How I know this: In Quickbooks, I ran a report under “Manufacturing & Wholesale Reports” called “Sales by Customer Type” and filtered it for the “Drop Ship” type. Note: You have to be using the Quickbooks Premier: Manufacturing & Wholesale Edition to have access to this report. Another method would be to just compare sales from these accounts from one year to the other.
Overall I am very pleased with how the holiday sales turned out. It’s great to end the year on a high note and to sell through a lot of inventory. For 2016, I want to reduce the craziness by getting a headstart on some of these initiatives, especially pitching the gift guides and our social media campaigns earlier on.
If you had particular success with any of your holiday marketing strategies, please share in the comments below.