Yep, social media can be an awesome, inexpensive and fun way to connect with current and potential customers and their communities. It can also be an excellent way to waste a lot of time and money. Are you wondering if your social media efforts are paying off? Here’s my method for how to measure social media for free (and not just for a first 30 day trial period either).
In the old days, people were obsessed with growing their fans and followers above all else. Times have changed, as we’ve learned that those metrics are not a good indicator of how well you’re connecting with your audience. Rather than counting how many fans you have or how often you are posting, pay attention to your engagement rate. Engagement is how often people interact with your content, either by liking it or sharing it or commenting on it.
The engagement rate is a blend of likes/comments/shares, but at Po Campo we break it down to look at each action separately. This takes more effort, but it sheds light on how the different platforms behave and helps you understand what to do to up your game in each space.
The Engagement Rate can be broken down into:
- Conversation Rate (Comments per post)
- Amplification Rate (Shares per post)
- Applause rate (Likes per post)
I used Facebook terminology, but all social media platforms have their equivalents. For example, on Twitter, Conversation = replies, Amplification = re-tweets, and Applause = favorites.
This concept was first introduced by Avinash Kaushik in his post “Best Social Media Metrics: Conversation, Amplification, Applause, Economic Value“, where he advocated measuring the outcomes and not activity. At the time, there was no easy way to get these numbers. Now, thankfully, there is. TrueSocialMetrics offer a service that measures these things automatically for you.

However, TrueSocialMetrics is not free; their most basic package is $30/month. While not terribly expensive, those monthly costs really add up, so I wanted to compare how much it would cost to do the same measurements internally. After devising this method on how-to measure social media, I found out that we could do it once a month for half the cost. Once a month is a frequency that works for us because, well, we’ve got other things to do besides just measuring social media.
In devising our own system, I added a few more metrics:
- Click-Through Rate, since one of our social media goals is to increase web traffic
- Relative Engagement Rate, to compare how active each follower is on each platform
- Economic Value Rate, to see how much money each social media platform brings in

I created a template on Google Docs for you to use. It consists of two worksheets:
The first tab is a worksheet where you enter your data in the top portion and the rates are automatically calculated below. We do this on the first day of the month. In my example above, you can immediately see which platforms are performing better across the different metrics: Facebook is great for conversations and sharing, Pinterest users are more engaged, Instagram gives us the loudest “applause”, meaning our content there is resonating well. Our Twitter account obviously is lacking across all metrics. I’ll dig deeper into what to do with these learnings in a separate post, but I bet you already have some ideas.
The second is a worksheet that calculates your month over month improvement. I meet with my social media team member in the beginning of each month to review our numbers and to identify what is working well and what needs some help.
Your next question is probably where to find the numbers to populate the top part of the “How-To Measure Social Media” table. Well, here you go! Below is how to find your data, platform-by-platform, using completely free services. Once you do it once, it’ll become quicker, I swear.
Jump to a specific social media platform: Facebook, Twitter, Pinterest, or Instagram.
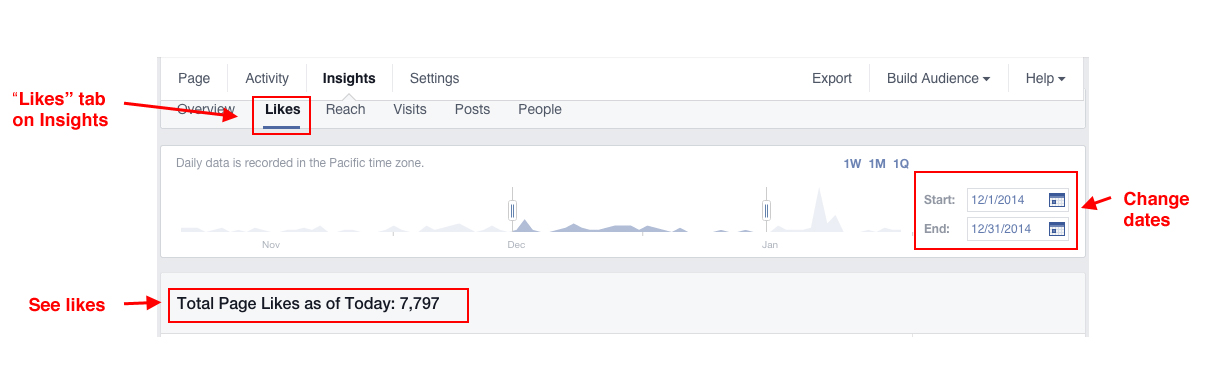
- # of Likes
- Go to your Facebook page’s Insights panel and click on Likes tab.
- Update dates at right side
- See total likes beneath graph
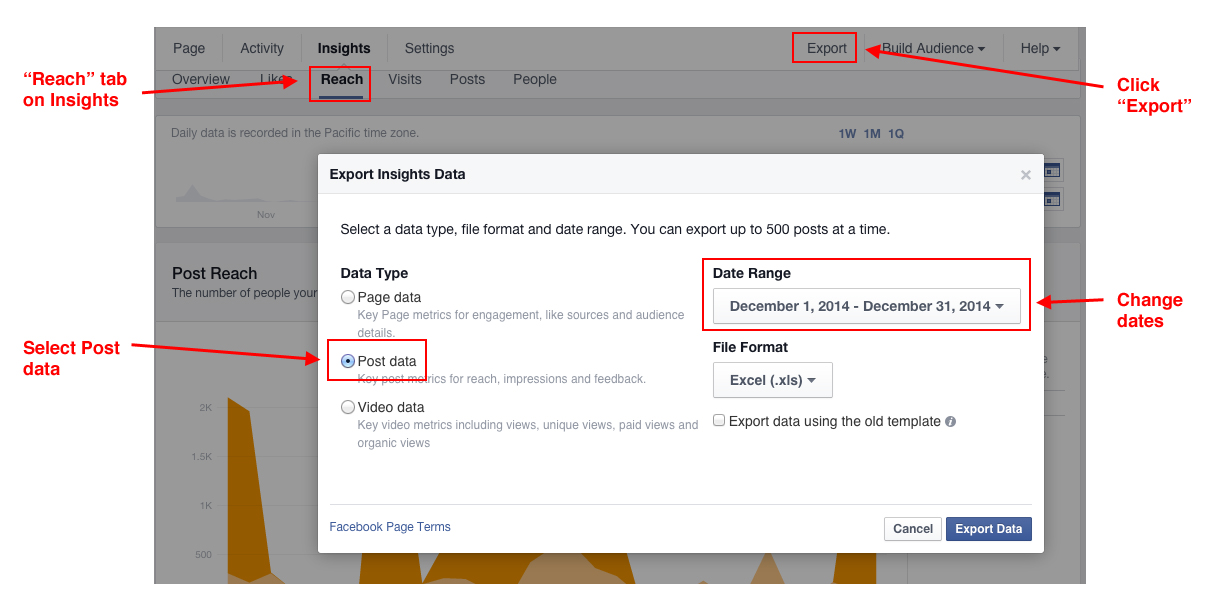
- # of Posts / Comments / Shares / Likes
This one unfortunately isn’t as straightforward because Facebook Insights shows you the average amount of comments/shares/likes that your posts received, not the totals, which are needed to calculate the rate. I prefer the rate over the average so you know how effective your posts are. If you can accomplish the same results with 20 posts instead of 200, that is a better use of time, and only the rate gives you that information.
- Go to your Facebook page’s Insights panel and click on Reach tab and click Export.
- Change dates in pop-up window and select the “Post Data” report
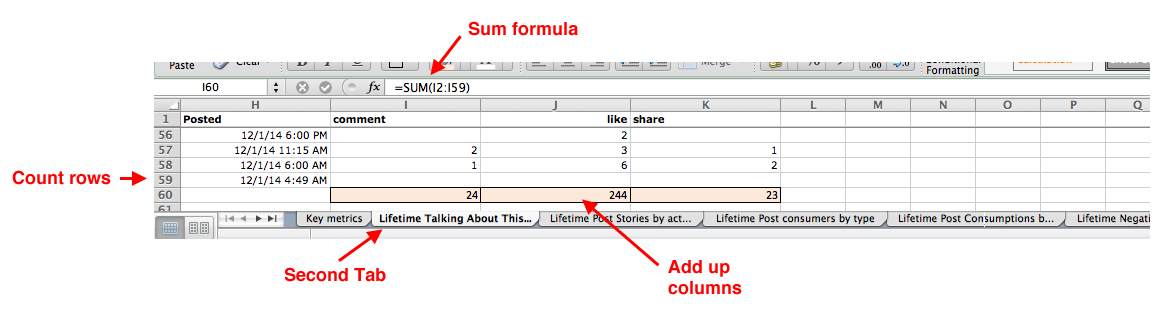
- Open the report in Excel and try not to feel overwhelmed. Navigate to the second tab titled “Lifetime: The number of unique people who created a story about your Page post by interacting with it. (Unique Users)”.
- See how many rows there are and subtract by two so as to not count the headers. This is your # of Posts value.
- Add up the values in Columns I, J and K (comment, like and share, respectively) to get those values.
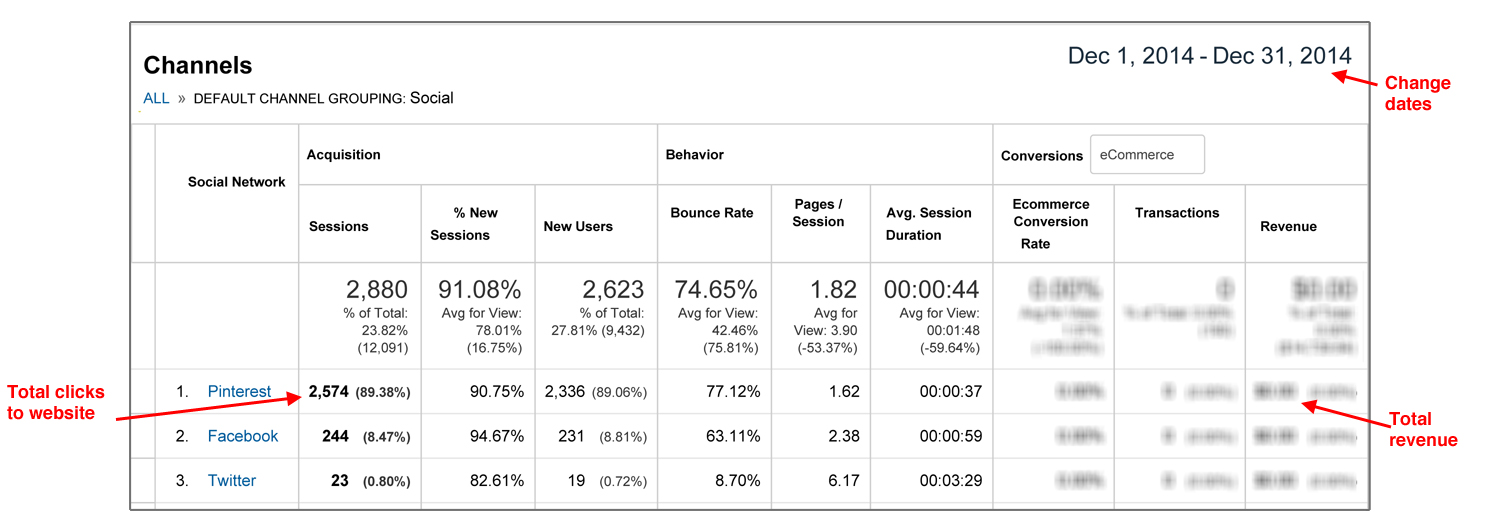
- # of Clicks to Website & Total Revenue
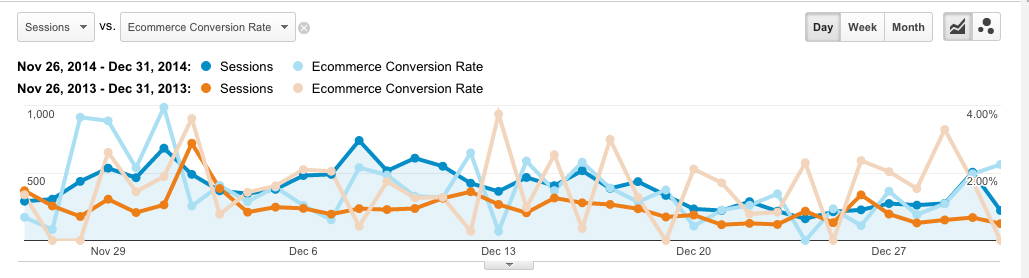
These last two values can be found in Google Analytics. You need to check both the “Social” channel and “(Other)” channel, as traffic from smartphone apps sometimes shows up in the latter.
- In Analytics, go to Acquisition > All Traffic > Channels and change the date at top.
- Click on Social to see traffic coming directly from the social media sites. Write down the total number of sessions (clicks to website) and total revenue.
- Go back to the Channels report and click on (Other) to see more traffic from those platforms that came to your site from a different app. Again, write down the sessions and total revenue from each channel.
- Add the values from #2 and #3 together and put them in the worksheet.
Twitter
You’ll need to set-up a free Twitter analytics account to access these reports.
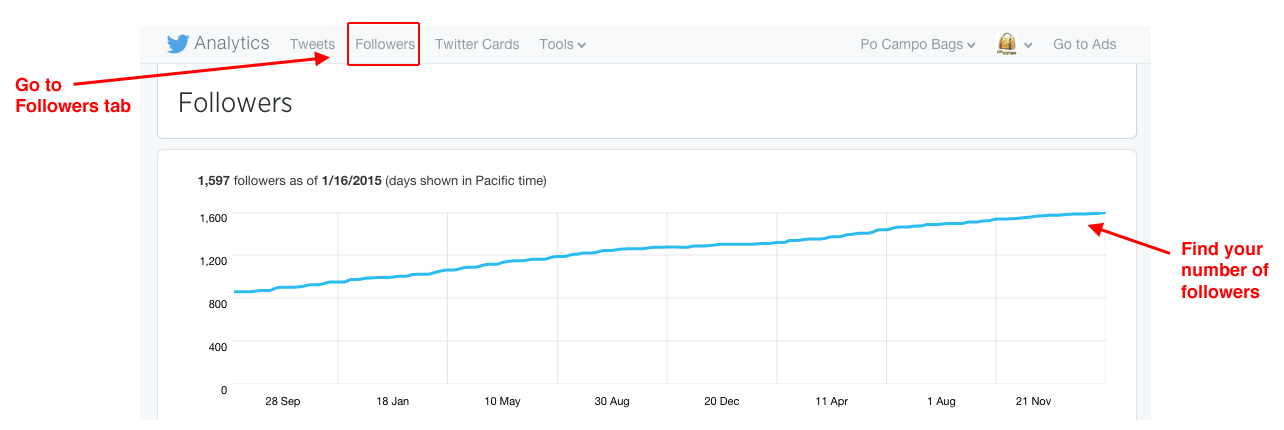
- # of Followers
- In your Twitter Analytics page, go to “Followers” tab
- Find your number of followers on a particular date on the bar graph.
- # of Posts / Replies / Retweets / Favorites
Similar to Facebook, Twitter Analytics makes it easy to see the averages but difficult to see the totals. You have to download the data and add it up in Excel.
- In Twitter Analytics, go to “Tweets” tab and click “Export Data”. This can take awhile because it exports ALL your data.
- Once opened in Excel, copy the rows of tweets that were posted in your time period and paste into a new worksheet. (This is optional, just makes it easier to work with).
- Count the number of rows to get your # of Posts value.
- Similar to the facebook data above, add the values in column H, I, J to get your total Retweets, Replies, and Favorites, respectively.
- # of Clicks to Website & Total Revenue
These last two values can be found in Google Analytics, same as above.
Pinterest
You will have to set up a free business account on Pinterest to get access to their analytics.
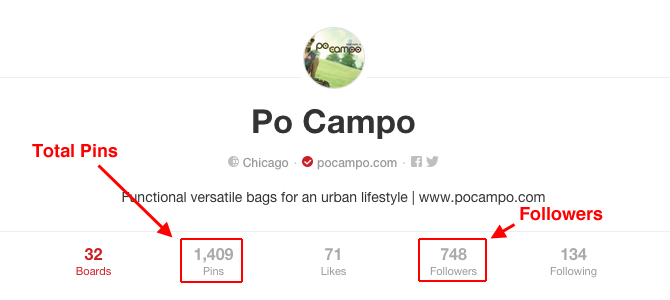
- # of Followers and # of Pins
- Your # of followers can be found on your main profile page. There is no way to find it back-in-time, so just be diligent about recording this number on the last day of the month.
- There’s no way to see how many new pins you posted during the time period, but pins tend to live on longer on Pinterest anyway. Therefore, we record the total # of our pins on all of our boards for this metric.
- # of Repins / Likes
Once again, you have to download the raw data to be able to count these metrics, as Pinterest analytics only gives you the averages for a certain time period. The raw data only shows you your top pins, not everything, but I’ve found this to be workable. Sadly, Pinterest Analytics does not offer a “comment” metric, so we are unable to determine the conversation rate for this platform.
- In Pinterest Analytics, go to Your Pinterest Profile tab and select the Impressions option. Change the date and then click “Export”.
- Similar to the facebook data above, in the”Top Pin impressions” section, add the values in column G & H to get your total number of repins and likes.
- # of Clicks to Website & Total Revenue
These last two values can be found in Google Analytics, same as above.
Instagram
Instagram does not offer its own analytics yet. We use a free account on Iconosquare for these basic metrics. Most of their statistics are on a rolling monthly basis, so it’s best to be diligent about getting these numbers on the last day of your recording period. Since Instagram does not really have a “Share” option, we skip the Amplification rate for this medium.
- # of Followers
- Navigate to the “Statistics” tab in Iconosquare. Your number of followers is on the main Overview page.
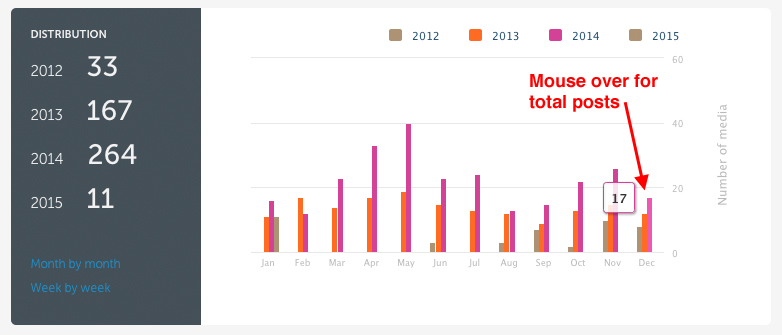
- # of Posts
- Click on “Content” on the left side. Your # of our posts during each month are visible in the Distribution graph.
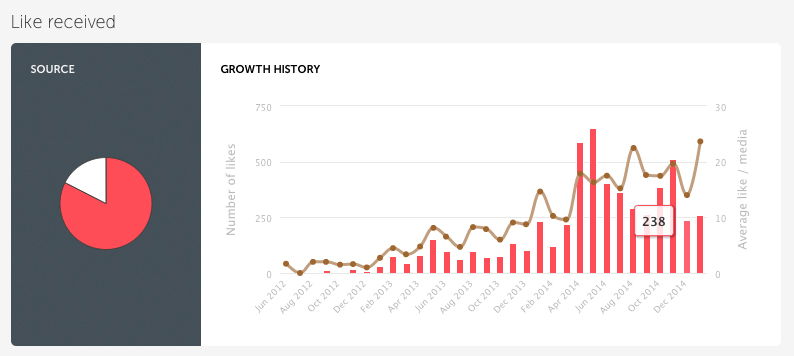
- # of Likes / Comments
- In Iconosquare, click on “Engagement” on left side. In the “Like Received” graph, mouse over the bar for the month to see the total number of likes.
- For Comments, do the same thing on “Comment Received” graph.
- # of Clicks to Website & Total Revenue
These last two values can be found in Google Analytics, same as above. Instagram traffic will most likely show up only on the “(Other)” channel, for whatever reason.
Now that you know where to find your measurements, and what to do with them (put them in my Measuring Social Media table!), I look forward to hearing about your insights. If you have better tools, please share, especially if they are free. It seems like most services are built for agencies managing multiple brands or big brands with big budgets, and not too much for us little guys. That’s why this DIY method seems like the best option for right now.